U.S. Cutting Tool Orders totaled $204.5 Million in January 2024 up 9.1% From December 2023
January 2024 U.S. cutting tool consumption totaled $204.5 million, according to USCTI and AMT. This total was up 9.1% from December’s $187.5 million and up 4.1% when compared with the $196.5 million reported for January 2023. January 2024 U.S. cutting tool consumption totaled $204.5 million, according to the U.S. Cutting Tool Institute (USCTI) and AMT – The Association For Manufacturing Technology. This total, as reported by companies participating in the Cutting Tool Market Report collaboration, was up 9.1% from December’s $187.5 million and up 4.1% when compared with the $196.5 million reported for January 2023. “January cutting tool shipments are a good start to 2024 and indicate that the expected decline will not be as severe as some fourth-quarter predictions that were based on the contraction in durable goods spending,” asserted Jack Burley, chairman of AMT’s Cutting Tool Product Group. “Job shops are reporting business activity, and quoting has slowed down some; however, large original equipment manufacturers in automotive, truck, and aerospace are still investing in new production lines. Overall, there is optimism within the industry for continued growth this year.” Tom Haag, president at Kyocera SGS Precision Tool, elaborated further, stating: “January activity started quite slow after the holidays but appeared to recover as the month progressed and carried into February. We are hopeful that the inventory depletions at the close of 2023 are now being replenished to prepare for a solid manufacturing year in 2024. Commercial aerospace has a 10-year backlog to address, and if automotive manufacturing can sort out whether to produce electric vehicles or internal combustion engines, 2024 could prove to be a strong year in metalworking. With 2023 being an exception, we expect the first three months of 2024 to set the tone for the year, barring any geopolitical interruptions.” The Cutting Tool Market Report is jointly compiled by AMT and USCTI, two trade associations representing the development, production, and distribution of cutting tool technology and products. It provides a monthly statement on U.S. manufacturers’ consumption of the primary consumable in the manufacturing process – the cutting tool. Analysis of cutting tool consumption is a leading indicator of both upturns and downturns in U.S. manufacturing activity, as it is a true measure of actual production levels. Historical data for the Cutting Tool Market Report is available dating back to January 2012. This collaboration of AMT and USCTI is the first step in the two associations working together to promote and support U.S.-based manufacturers of cutting tool technology. The graph below includes the 12-month moving average for the durable goods shipments and cutting tool orders. These values are calculated by taking the average of the most recent 12 months and plotting them over time.
Manufacturing Technology Orders down 31% from December: contract machine shops decrease orders
Orders of manufacturing technology, measured by the U.S. Manufacturing Technology Orders Report published by AMT – The Association For Manufacturing Technology, totaled $338 million in January 2024, a 31% decline from December and a 3.7% decline from January 2023. The value of orders in January 2024 was at the lowest level for January 2021, yet the unit count was the lowest since 2016. This indicates the demand for manufacturing technology is still being driven by orders of highly specialized, automated machinery. Contract machine shops, the largest customer of manufacturing technology, decreased orders in January 2024 to the lowest level since July 2023, a 27.1% decline from December 2023. These shops have been ordering below their typical share for some time now. Should business conditions improve for these manufacturers, there is a large upside potential for future orders of manufacturing technology. Contract machine shops are expected to continue experiencing subdued order activity shortly. Despite a minor improvement in February 2024, the Gardner Metalworking Index – compiled by Gardner Business Media and predominantly based on responses from contract machine shops – indicates that the downturn in business activity is likely to persist for at least another month. Outside of the aerospace and automotive sectors, OEMs in many other industries are generally small consumers of manufacturing technology in any given month relative to the size of orders from contract machine shops. However, for some time now, this has inverted, as OEMs across several industries have increased orders at a pace that has nearly offset the decline in orders from contract machine shops. Manufacturers of oil and gas field machinery were among the OEMs increasing orders in January 2024. According to data published by the Texas Oil and Gas Association, 2023 set records in both the extraction and refining of oil and natural gas in the state. In recent years, elevated orders for manufacturing technology from this sector have typically been placed in the fourth quarter of the year. The early uptick in 2024 could indicate an appetite to expand capacity and modernize equipment to compete with recent regulatory hurdles. January is typically the slowest month for manufacturing technology orders in any given year, and 2024 may prove to be no different. Forecasters at Oxford Economics have predicted that global industrial production will increase 2.7% in 2024. This bodes well for manufacturing technology, as even non-durable goods producers require machinery that is built using the metalworking equipment tracked by USMTO. Indeed, Oxford Economics also presented a forecast at AMT’s Winter Economic Forum, predicting that manufacturing technology orders in the United States would increase nearly 8% in 2024.
Softeon hosts two innovative warehousing solutions sessions during MODEX
Softeon Warehouse Management System (WMS) experts will share the latest in WMS implementations, automated warehousing, and material handling at MODEX in Atlanta Softeon has announced it will share the latest in WMS implementations, automated warehousing, and material handling during two live sessions during MODEX 2024 at the Georgia World Congress Center in Atlanta, March 11-14. During MODEX, Softeon is sharing warehouse automation strategies, live demonstrations, and expert networking opportunities. In addition to exploring Softeon’s WMS software at Booth #C7466, MODEX attendees have the opportunity to engage with company leaders during two sessions: “Ensuring the ROI from WMS Implementations” | Brian Pier, VP, Solution Delivery Tuesday, March 12 | 1:30 – 2:15 p.m. ET | Theater A “Successfully Navigating the Great Material Handling Integration Challenge” | Mark Fralick, CTO Wednesday, March 13 | 3:30 p.m. – 4:15 p.m. ET | Theater I “Automation continues to be a solution for labor challenges, and automation and the integration of several platforms in turn cause operational challenges,” said Mark Fralick, Chief Technology Officer, Softeon. “Integration continues to be a major issue and barrier to success, leading to slow time-to-value. During my MODEX session, I’ll discuss how companies can get faster at WMS deployment. I also look forward to discussing how warehouse execution systems (WES) are enabling the orchestration of fulfillment processes across automated and non-automated processes, as well as the importance of mobile robot platforms for managing robots of different types and vendors in one environment.” According to a Gartner report, by 2026, over 50% of companies deploying intralogistics robots will have a multiagent orchestration platform. Hence, Fralick will discuss the need to be equipped with capable software to successfully integrate with the technology needed to meet the current and future needs of some of the world’s most complex warehouses. “Companies can improve WMS results by optimizing microflows and by leveraging a composable WMS, which creates flexibility and agility; therefore creating higher levels of adaptability and ROI over time,” said Brian Pier, Vice President of Solution Delivery, Softeon. MODEX attendees can hear first-hand from Pier about how to deliver expected results and reach time-to-value faster. In addition to attending Softeon’s warehouse-related sessions, MODEX attendees can join in a hole-in-one putting contest at the company’s booth #C7466. Global supply chain leaders are encouraged to register to meet with Softeon’s team during MODEX. Gartner “Predicts 2023: Supply Chain Technology” Dwight Klappich, Christian Titze, Tim Payne, Amber Salley, Simon Tunstall; 28 November 2022.
Key takeaways from the fourth quarter Plastics machinery shipment
The Plastics Industry Association’s Committee on Equipment Statistics (CES) has unveiled the fourth-quarter shipment data for primary plastics machinery, covering injection molding and extrusion activities in North America. Initial estimates for Q4 2023 indicate a shipment value of $348.1 million, reflecting a 0.4% decrease from the revised figure of $349.6 million in the preceding quarter. When compared to the same period in the previous year, the value of shipments shows a notable 19.5% decrease. In the domain of primary plastics machinery, single-screw extruders experienced a notable 19.5% decrease in quarter-over-quarter (Q/Q) analysis but showed a 4.9% increase year-over-year (Y/Y). Twin-screw extruders also witnessed a comparable decrease of 19.4% Q/Q and a more substantial 23.8% decrease Y/Y. Conversely, injection molding shipments increased by 3.8% Q/Q but faced a 21.1% decrease Y/Y. “Last year saw minimal fluctuations in quarterly plastics machinery shipments. The modest upturn observed in the second quarter was short-lived, with shipments remaining steady until the year’s end,” noted Perc Pineda, Chief Economist at PLASTICS. “The decline in U.S. manufacturing activity, coupled with a high-interest-rate environment, contributed to a slowdown in business investment spending, including in plastics machinery,” Pineda added. In the latest quarterly survey by CES polling plastics machinery suppliers for market insights and equipment expectations, results showed a notable uptick in participants anticipating improved market conditions over the next twelve months compared to the previous year. The percentage of those expecting conditions to either remain the same or improve rose to 82.9%, signaling optimism compared to the 56.1% recorded in the prior quarter. As 2023 concluded, U.S. exports of plastics equipment saw a 5.1% increase in the fourth quarter, reaching $284.6 million from the previous quarter. Year-over-year exports surged by 19.6%. Mexico and Canada maintained their positions as the top export markets for U.S. plastics equipment, accounting for a combined export share of 62.3%. Half of these exports, totaling $124.3 million, were directed to Mexico, while less than a fifth (18.6%) to total exports went to Canada, totaling $53.0 million. Meanwhile, imports experienced an 11.7% quarter-over-quarter increase, reaching $427.6 million, but faced a 14.1% year-over-year decrease. “While the unexpected 2.5% U.S. economic growth in 2023 averted a recession, primarily fueled by robust household spending in the services sector, signs of recovery may emerge in 2024. Sustained consumer spending could prevent economic deterioration, especially if labor markets continue to stay healthy. As interest rates begin to return to normalcy from inversion, there’s a likelihood that business investment, including in equipment, will reverse course,” remarked Pineda.
The hidden costs of industrial printing and how to reduce them
Identify hidden costs in two minutes with the total-cost-of-ownership-calculator How much do the printers you use on your production line cost? What we mean is, how much do they cost? As the pressure increases on producers and packagers to make their production lines more efficient, we are often asked about how our customers can reduce their printing costs. And the answer we give often surprises them. Here are six ways that your printers cost money and how to reduce your total cost. Not only that – you will also get access to our new TCO calculator, which will give you an actual figure personalized to you and your business. So where is all that money going? 1. Downtime This is the cost that is most often overlooked when talking about coding & marking. Downtime can be created by poor print quality as well as by poor printer performance. Some conventional printers need cleaning between pauses in production. So, the production line sits idle while someone takes the printer through the cleaning cycle. Some printers can take up to 20 minutes to stabilize before they are ready to print again. This delay costs money: according to Senseye’s True Cost of Downtime Report, the cost of a lost hour ranges from USD 39,000 in the FMCG sector to more than USD 2 million in the automotive sector. With LEIBINGER, this is not a cost you need to worry about. The LEIBINGER printer technology keeps unused ink in a 100% airtight system. It doesn’t dry out or clog, production schedules are not held up for cleaning, and no precious production time and money is wasted. High-quality printing results are guaranteed at any time. 2. Maintenance It’s important to keep machines serviced and in good working order, and this can be a significant part of the overall cost unless you have a LEIBINGER IQJET. The IQJET is maintenance-free for five years. This is possible because we use durable, high-quality components and a unique product design that minimizes ‘wear and tear’ (e.g. no need for a continuously running feed pump). And it removes the maintenance cost altogether. In contrast many of the other prominent printing solution providers today seem to lack a crucial focus on minimizing parts and maintenance requirements, as their approach revolves around the wholesale replacement of entire ink core modules, which means the entire hydraulic system, at predetermined time intervals such as annually or biennially. Typically, this process is governed by timeout chips, leading to automatic printer shutdowns when these intervals expire. Consequently, this enforced printer downtime results in production halts for manufacturers. This approach not only lacks sustainability but also incurs exorbitant costs. We are not merely referring to the substantial expenses incurred in replacing ink core modules, which are up to USD 1.500 per year; Downtime costs, in terms of lost production, are equally significant. Therefore, the query regarding maintenance and spare parts policies should be one of the primary questions to ask your coding and printing solutions provider, as it can constitute a significant long-term cost factor. 3. Labor Given the current labor shortage, it is particularly important to consider the time cost of people. How long do operators spend setting up or cleaning printers? Or re-programming them between jobs? What is the expected timeframe for commissioning and installation at the facility? Printers that are easy to install, manage, configure, and with remote control options. For example, staff don’t have to walk miles around the plant to operate them will cost less in the long run. Such features are included in LEIBINGER printers. The Plug & Print performance of IQJET is unparalleled in the global market. The drag-and-drop interface and the simplest print job creation process are not only effortless but also highly intuitive, and no extensive training of employees is required. 4. The purchase price The most obvious cost of printing is the upfront cost of equipment, although this is typically less than 30% of the total costs. As with everything, a high-quality, reliable brand will cost more than a cheaper one. And of course, printers cost more if they go faster or provide more features – so the best way to economize is to ensure you don’t pay for features or speeds that you don’t need. In the long term, the best bet is a reputable supplier with a wide range so you can find a price point that suits you. 5. Consumables Reduce the amount of ink and solvent you use, and reduce your costs.Not all printers perform equally. LEIBINGERs latest printers have one of the lowest consumption ratings on the market, 2.7 ml per hour of solvent for MEK inks (competing products typically consume between 6 and 10 ml per hour), and we make sure that ink cartridges are emptied down to the last drop and do not require separate disposal (unlike many conventional CIJ systems). So, you pay less for your consumables. 6. Power Energy prices remain high, so the power required to run your printers is an important factor. Not only does it cost money, but it also contributes to your organization’s carbon footprint. Choose equipment with a low wattage rating, such as our new IQJET: drawing only 36W it costs less than any other printer to run. Show me the money! While it is useful to know the different ways that your printers cost money, you need to see the numbers. You need to know exactly how much you’re paying and how much could you save. And with our online Total Cost of Ownership Calculator, you can have those numbers in about two minutes. Check out the Total Cost of Ownership Calculator now. About the Author: About Paul Leibinger GmbH & Co. KG (LEIBINGER) LEIBINGER is a globally operating specialist in coding & marking systems with headquarters in Tuttlingen, Baden-Württemberg (Germany). The third-generation family-run company, founded in 1948, develops and produces industrial inkjet printers as well as inks for various applications – with a workforce of close to 300. Innovative technologies and an
Nearly $147,000 raised in first stage of PTDA Foundation’s Fundraising Campaign
The PTDA Foundation is off to a strong fundraising start in 2024, raising nearly $147,000 during the first three months of its 2024 Fund Drive campaign. Contributions support the PTDA Foundation in empowering PT/MC (power transmission/motion control) industry employers to be more successful in their recruitment and retention efforts. “Our industry plays a crucial role in driving the global economy, and the individuals we bring on board our companies are fundamental to its growth and prosperity,” says 2024 PTDA Foundation President Matt Pavlinsky, Applied Industrial Technologies. “Our employers need help in securing and retaining the best talent and cultivating exceptional teams. This year, as the Foundation prepares to launch new scholarship programs and a bold campaign to raise awareness of careers within our industry, we are grateful to those who demonstrated a commitment to our vision with a pledge to the 2024 Fund Drive. We look forward to sharing more information on these two exciting programs soon.” Thank you to these 2024 PTDA Foundation Vanguard Contributors who led our fundraising efforts with a pledge made October 2023 – January 2024. Partner Contributors ($15,000+) Allied Bearing & Supply, Inc. Investor Contributors ($10,000-$14,999) Applied Industrial Technologies Stakeholder Contributors ($5,000-$9,999) Continental Dodge Industrial DXP Enterprises, Inc. NSK Americas NTN Bearing Corporation of America WEG Benefactor Contributors ($2,500-$4,999) BDI Americas (USA & Canada) Bearing Service Inc. Flexco Houston Bearing & Supply Co., Inc. Interlynx Systems Lafert North America NTN Bearing Corp. of Canada Ltd. Precision Pulley and Idler (PPI) RBC Bearings/Climax Metal Products Renold U.S. Tsubaki Power Transmission LLC (UST) W.C. DuComb Co., Inc. Leadership Contributors ($1,000-$2,499) FICODIS JIE USA Inc. M. B. McKee Co., Inc. Moline Bearing Company PEER Chain Pfannenberg San Antonio Belting & Pulley Company, Inc. Transply, Inc. Webster Industries Foundation Sponsor Contributors ($500-$999) Beardslee Transmission Equipment Co., Inc. Bearing Chain & Supply, Inc. Belden Universal Brewer Machine & Gear Co. Dayco Incorporated Freudenberg-NOK Sealing Technologies Integrated Distribution, Inc. KHK USA Inc. MAXCO Chain MPT Drives, Inc. Orthman Conveying Systems Overly Hautz Motor Base Co. TBC, Inc. Texas Bearing Company USA Roller Chain & Sprockets Colleague Contributors ($250-$499) Royersford Foundry & Machine Co., Inc. Whittet-Higgins Company Individual Contributors Rex Davis Paul Dent Hafeez Hameer Betsy & Alan Haveson Sue & John Masek (in honor of Mary Sue Lyon and in memory of Terry Hutton) Mike & Katie McLain Bill Moore Keith & Sharon Nowak (in memory of Ed Nowak) Matt Pavlinsky Barb Ross Jos Sueters The PTDA Foundation 2024 Fund Drive has a goal of $300,000. To date, the Foundation has raised 49 percent of its goal. Pledges can be made online, or you may download a pledge form at ptworkforce.org/GiveNow.
Federal HazMat and Emergency Management Expert joins safety non-profit
The Alliance for Innovation and Infrastructure (Aii) has named Timothy P. Butters to its Board of Directors. Butters, a senior executive in the Administration of Barrack Obama, served as the Acting Administrator and Deputy Administrator of the Pipeline and Hazardous Materials Safety Administration (PHMSA), where he was instrumental in safely and securely overseeing all hazardous materials shipped via air, land, rail, sea, and pipeline. “I am honored to be joining the Aii Board of Directors, and I look forward to leveraging my expertise as we address pressing issues,” said new Aii Board Member Timothy P. Butters. Following PHMSA, Butters also served at the Federal Aviation Administration (FAA), where he served as a senior advisor in FAA’s Office of Airports and provided public safety expertise in several key program areas including Unmanned Aircraft, Aviation Event Emergency Planning, and Commercial Space Transportation. Before his federal service, Butters was a professional firefighter and EMT in Fairfax City, Virginia, retiring as an Assistant Fire Chief. As a first responder, Butters was a member of the National Capital Region Type III Incident Management Team (IMT). He has been deployed to major disaster sites to support local incident management operations, including Hurricanes Katrina (MS) and Ike (TX), wildfires, presidential inauguration support, and other large events. Butters has also held senior leadership positions with the International Association of Fire Chiefs, the Chemical Transportation Emergency Center (CHEMTREC), and the Federal Emergency Management Agency. “We are fortunate to have Tim join the Board,” said Aii Chairman and Founder Brigham McCown. “Tim’s expertise as a first responder and regulator is a huge asset to our mission.” Celebrating a decade of non-partisan public policy service, the Alliance for Innovation and Infrastructure seeks to foster innovative solutions to significant infrastructure and public policy challenges.
February 2024 Logistics Manager’s Index Report® LMI® at 56.5
Growth is INCREASING AT AN INCREASING RATE for Inventory Levels, Warehousing Utilization, Transportation Capacity, Transportation Utilization, and Transportation Prices Growth is INCREASING AT A DECREASING RATE for Inventory Costs and Warehousing Capacity Growth is HOLDING STEADY for Warehousing Prices The Logistics Manager’s Index reads in at 56.5 in February 2024. This is up (+0.9) from January’s reading of 55.6 and is tied with October 2023 for the highest reading for the overall index in the last year. For the second month in a row, this growth is bolstered by expansion in all eight sub-metrics captured in the index. This is driven by a continued expansion in Inventory Levels (58.5) which has led to a tightening in Warehousing Capacity (52.8) and growth across all three transportation metrics. Particularly notable is the expansion in Transportation Prices, which at 57.6 have reached their fastest rate of growth since the start of the freight recession in June 2022. Interestingly, Transportation Capacity was also up this month to 60.9, bumping it higher than Transportation Prices and suggesting that we have not yet entered a true growth period in the freight market. Researchers at Arizona State University, Colorado State University, Florida Atlantic University, Rutgers University, and the University of Nevada, Reno, and in conjunction with the Council of Supply Chain Management Professionals (CSCMP) issued this report today. Results Overview The LMI score is a combination of eight unique components that make up the logistics industry, including inventory levels and costs, warehousing capacity, utilization, and prices, and transportation capacity, utilization, and prices. The LMI is calculated using a diffusion index, in which any reading above 50.0 indicates that logistics is expanding; a reading below 50.0 is indicative of a shrinking logistics industry. The latest results of the LMI summarize the responses of supply chain professionals collected in February 2024. The LMI read in at 56.5 this month, up (+0.9) from January’s reading of 55.6. This is the sixth time in the last seven months that the LMI has shown expansion. This growth is driven by continued progress in transportation and the buildup of inventories upstream at the manufacturing and wholesale levels. The overall index is up, but still below the all-time average of 62.4 – which in many ways epitomizes the current slow but positive and steady state of the U.S. economy. The University of Michigan Consumer Confidence Index stayed high in February, reading in at 76.9. While this is down (-2.4) from January’s reading of 79.0 it is up 14.9% from the same period last year[1]. While core inflation in the U.S. was up by 0.4 percent in January, the PCE index (the Fed’s preferred measure) was only up 2.4 percent, which is down from the 2.6 seen in December. When taken together, the economy continues to grow, and consumer prices are largely moderating – though likely not quickly enough for the Fed to consider a cut to interest rates at their meeting in mid-March[2]. One of the factors behind the strong U.S. economy is immigration. Net immigration from August 2022 to July 2023 was the highest it has been since 2017 and immigrants now make up 18.6 percent of the labor force in the U.S., which has been a relief to some businesses that struggled with labor during the pandemic years. This is largely driven by tripling in refugees how have been granted asylum and quickly entered the labor force (up to 1.2 million from 423,000 year-over-year). This is bolstered by increased domestic energy production as the U.S. has continued to be a net exporter of energy[3]. While it may be politically complicated, abundant labor and abundant energy is a combination that is unique to the U.S. and is likely a major factor behind the increased pace of economic recovery seen in the U.S. relative to other developed nations. Eurozone inflation was down to a 2.6 percent annual increase in February which is lower than expected and down from the 2.8 seen in January. This is spurred on by lower energy prices across the continent[4]. The February Chinese service PMI was up to 51 in February which is its highest reading since September. Conversely, China’s manufacturing PMI was down to 49.1, which is lower than January and marks the sixth consecutive month of contraction, something that is a worrying sign for the country that is colloquially known as “the world’s factory”. Chinese manufacturing is being challenged by subdued domestic spending as well as tensions with many of their primary trade partners[5]. It will be interesting to see if the U.S. and European economies can truly reach robust rates of growth if the world’s second-largest economy continues to struggle. There is slowness north of the border as well as retail sales were down by 0.4% in Canada in January (although this came after a stronger-than-expected increase of 0.8% in December, so this could be a regression to the mean). Much like the U.S., Canada’s economy is growing but at a slower pace and the Canadian central bank is expected to leave interest rates where they are at their March meeting[6]. The resilience of the U.S. economy is apparent in Transportation Price movements. After moving from contraction to expansion for the first time in 20 months in January, Transportation Price growth increased again (+1.8) to 57.6 in February. This is a function of demand and not cost, as increasing Transportation Prices came despite U.S. diesel costs being down to $4.058 per gallon in the last week of February, which is $0.236 down from the same time a year ago[7]. Additionally, fears that the increases were only due to issues in the Red Sea also seem to have subsided with the price spikes due to Houthi attacks seem to have peaked as shipping rates from Asia to the U.S. declined in February. Rates are still up by over 100% from where they were in early December, but they have dipped slightly in recent weeks[8]. That does not mean the crisis is over. Maersk recently predicted that they
U.S. Rail report for February & the week ending March 2, 2024
The Association of American Railroads (AAR) has reported U.S. rail traffic for the week ending March 2, 2024, as well as volumes for February 2024. U.S. railroads originated 885,548 carloads in February 2024, down 1.3 percent, or 11,410 carloads, from February 2023. U.S. railroads also originated 1,040,312 containers and trailers in February 2024, up 10.9 percent, or 102,140 units, from the same month last year. Combined U.S. carload and intermodal originations in February 2024 were 1,925,860, up 4.9 percent, or 90,730 carloads and intermodal units from February 2023. In February 2024, 13 of the 20 carload commodity categories tracked by the AAR each month saw carload gains compared with February 2023. These included: motor vehicles & parts, up 6,777 carloads or 12.3 percent; chemicals, up 6,522 carloads or 5.1 percent; and grain, up 4,971 carloads or 6.3 percent. Commodities that saw declines in February 2024 from February 2023 included: coal, down 31,912 carloads or 11.7 percent; crushed stone, sand & gravel, down 8,037 carloads or 10.1 percent; and nonmetallic minerals, down 1,467 carloads or 12.7 percent. “In February, U.S. rail traffic recovered from disruptions caused by severe winter weather in January. However, a closer look at February’s rail traffic data shows elements that inspire optimism and elements that call for caution,” said Dr. Rand Ghayad, the newly appointed Chief Economist at the Association of American Railroads. “Intermodal volumes have consistently grown over the past six months, signaling increased confidence among consumers and retailers. At the same time, carloads of industrial products remain below levels from last spring and summer, reflecting ongoing challenges in the industrial sector. “Looking ahead, we hope to see improvements in manufacturing output and consumer spending, which are key drivers of rail transportation. This comes as the goods-producing sector begins to rebound from the stagnation experienced in the sector following the post-COVID-19 period.” Excluding coal, carloads were up 20,502 carloads, or 3.3 percent, in February 2024 from February 2023. Excluding coal and grain, carloads were up 15,531 carloads, or 2.8 percent. Total U.S. carload traffic for the first two months of 2024 was 1,910,716 carloads, down 4.6 percent, or 91,135 carloads, from the same period last year; and 2,246,326 intermodal units, up 7.9 percent, or 165,335 containers and trailers, from last year. Total combined U.S. traffic for the first nine weeks of 2024 was 4,157,042 carloads and intermodal units, an increase of 1.8 percent compared to last year. Week Ending March 2, 2024 Total U.S. weekly rail traffic was 483,138 carloads and intermodal units, up 3.9 percent compared with the same week last year. Total carloads for the week ending March 2 were 220,406 carloads, down 4.3 percent compared with the same week in 2023, while U.S. weekly intermodal volume was 262,732 containers and trailers, up 12.0 percent compared to 2023. Eight of the 10 carload commodity groups posted an increase compared with the same week in 2023. They included motor vehicles and parts, up 1,625 carloads, to 15,890; metallic ores and metals, up 1,525 carloads, to 19,732; and miscellaneous carloads, up 1,303 carloads, to 8,939. Commodity groups that posted decreases compared with the same week in 2023 were coal, down 14,965 carloads, to 57,929; and nonmetallic minerals, down 1,797 carloads, to 28,835. North American rail volume for the week ending March 2, 2024, on 10 reporting U.S., Canadian and Mexican railroads totaled 324,643 carloads, down 4.6 percent compared with the same week last year, and 344,823 intermodal units, up 10.9 percent compared with last year. Total combined weekly rail traffic in North America was 669,466 carloads and intermodal units, up 2.8 percent. North American rail volume for the first nine weeks of 2024 was 5,792,102 carloads and intermodal units, up 0.9 percent compared with 2023. Canadian railroads reported 89,148 carloads for the week, down 3.6 percent, and 71,183 intermodal units, up 9.2 percent compared with the same week in 2023. For the first nine weeks of 2024, Canadian railroads reported a cumulative rail traffic volume of 1,393,380 carloads, containers and trailers, down 2.3 percent. Mexican railroads reported 15,089 carloads for the week, down 14.0 percent compared with the same week last year, and 10,908 intermodal units, down 2.2 percent. Cumulative volume on Mexican railroads for the first nine weeks of 2024 was 241,680 carloads and intermodal containers and trailers, up 4.7 percent from the same point last year. To view the weekly rail charts, click here.
New fireboat stations dedicated at Port of Long Beach
Facilities provide port-wide protection as part of a $109 million safety program Officials today dedicated two new Port of Long Beach fireboat stations that are greatly enhancing the Long Beach Fire Department’s waterside and landside emergency response capabilities, better safeguarding visiting ships, cargo, and waterfront workers. The facilities – Fireboat Station 15 and Fireboat Station 20 – are the products of a $109 million Port of Long Beach program to preserve business continuity, security, and economic interests. “These fireboat stations will provide an important and invaluable safety service to our Port,” said Long Beach Mayor Rex Richardson. “Our firefighters are now equipped with the most sophisticated facilities and emergency response capabilities to protect our Port, its valuable assets, and our waterfront workforce.” “This is a great day for the Port of Long Beach, as we celebrate the completion of a long-needed major revamping of fire safety facilities and equipment in the harbor,” said Port of Long Beach CEO Mario Cordero. “Fireboat Stations 15 and 20 and our fireboats vastly improve our preparedness and resilience in the face of emergencies.” “These new stations will have a lasting and positive impact on our ability to quickly respond to emergencies,” said Long Beach Harbor Commission President Bobby Olvera Jr. “We look forward to our continuing partnership with the Long Beach Fire Department to make the Port a safe place to work and do business.” “Our new fire stations are state-of-the-art public safety structures that will serve as bases of operations for any incident within the Port and throughout the region,” said Long Beach Fire Chief Dennis Buchanan. “Additionally, these stations have been designed with today’s workforce in mind, which means the assurance of workforce accommodations, such as separate sleeping quarters and restrooms.” Fireboat Station 15 is a single-level, 7,750-square-foot building in the Port’s outer harbor with living quarters, a garage for two firefighting apparatus trucks and a full wharf with a 16,311-square-foot boat bay enclosure that houses fireboat Vigilance. Construction started in April 2019 and the project was completed in September 2021. Fireboat Station 20, located in the Port’s inner harbor, is a two-level, 9,783-square-foot structure equipped with living quarters, a garage for two firefighting apparatus trucks and a 16,280-square-foot boat bay enclosure that houses fireboat Protector. Construction started in March 2021 and the project was completed in December 2023. Fireboat Protector entered service in 2016, followed a year later by its companion, Vigilance, heralding major advancements in harbor firefighting and emergency response capabilities at the Port of Long Beach. The fireboats are each equipped with 10 water cannons capable of sending up to 41,000 gallons per minute to a distance of up to 600 feet, or the length of two football fields. With an anticipated lifespan of 50 years, both stations were approved for construction in 2017 by the Long Beach Board of Harbor Commissioners and funded by Port revenues.
Workhound’s annual feedback trends report highlights State of Trucking in 2024
WorkHound, an employee feedback management for frontline workforce industries, unveiled its eagerly anticipated Annual Trends Report focused on top feedback trends in trucking for 2024. Based on nearly 100,000 anonymous frontline worker comments across 100+ logistics and trucking companies, the latest trends report dives deep into the workforce’s sentiments, concerns, and praises, spotlighting the most pressing issues and emerging trends across the industry. “2023 was a year with significant challenges in the trucking sector,” said Max Farrell, co-founder and CEO of WorkHound. “Despite facing a freight recession and new NLRB guidance, the industry demonstrated remarkable resilience. Federal initiatives began addressing the truck parking shortage, and the sector saw considerable mergers and acquisitions activity. Our latest workforce trend report leverages real-world feedback to illuminate the current state of the transportation industry, enabling employers to enhance the worker experience through a deeper understanding of their needs and concerns.” The report categorized driver comments into themes to simplify the data before measuring sentiment. The top theme of worker comments in 2023 was People, underscoring the crucial role of interpersonal connections in enhancing the work experience, particularly in roles where day-to-day interactions are not guaranteed. WorkHound’s sentiment analysis reveals positive relationships significantly boost morale and operational resilience. However, the breakdown of these connections leads to a ripple effect of dissatisfaction and challenges, emphasizing the profound impact of interpersonal dynamics on worker experiences. Key insights from the report: The top five feedback themes identified were People, Logistics, Equipment, Pay, and Praise, Some additional keywords identified were Raise, Weather, Sleep, Payroll, Breakdown, Planning, Lost, and Feeling. Praise theme aside, the majority of the themes featured comments with negative sentiments, and the report unveils some of the driving factors behind their dissatisfaction. Increased average comments per worker suggest a willingness – or need – among frontline employees to share their thoughts or concerns with employers. A 17% increase in mentions of “unions” from 2022 to 2023 and increased concerns about “pay” and “equipment reliability” reflect the evolving priorities and challenges faced by drivers. WorkHound’s commitment to leveraging AI for sentiment analysis and theme identification provides actionable insights for companies looking to improve retention, address employee concerns, and build a culture of trust and transparency. The findings serve as a roadmap for industry leaders to build a culture of trust and improvement, offering a clear view of the workforce’s evolving needs and priorities in real-time. “WorkHound remains dedicated to empowering companies to actively listen to their employees,” added Farrell. “Listening and communication are the keys to fostering better workplace environments and driving frontline industries toward a more inclusive, proactive, and positive future.” Click here to access the full WorkHound Annual Trends Report.
CVG presents “Contract Manufacturing Benefits to Your Process” Seminar at MODEX 2024
Join CVG at MODEX 2024 for an insightful seminar on “Contract Manufacturing Benefits to Your Process.” Hosted by Terry Shaw and Chris Quaglia, Senior Program Managers at CVG, this seminar will explore the transformative advantages of contract manufacturing for businesses seeking to optimize their processes. Seminar Details: Title: Contract Manufacturing Benefits to Your Process Presenters: Terry Shaw and Chris Quaglia, Senior Program Managers at CVG Date: Monday, March 11 Time: 1:30 – 2:15 PM Location: Theater G Commercial Vehicle Group (CVG) is a global leader in innovative solutions for the supply chain and material handling industries. With a focus on supply chain automation systems, CVG’s team of experts brings decades of experience in material handling equipment, operations management, sales, industrial engineering, and management. Attendees will gain valuable insights into the advantages of contract manufacturing, including significant cost savings, increased technical expertise, enhanced flexibility, scalability, end-to-end solutions, accurate cost estimates and deadlines, and faster time to market. With a focus on key takeaways such as highly experienced management, dedicated program management, emphasis on quality, flexible models, capacity for growth, highly trained personnel, and state-of-the-art facilities, this seminar promises to equip businesses with the knowledge and tools they need to thrive in today’s competitive landscape. Terry Shaw and Chris Quaglia bring a wealth of experience in supply chain automation systems, with strong backgrounds in material handling equipment, operations management, sales, industrial engineering, and management. As presenters of this seminar, Terry and Chris are dedicated to sharing their expertise and insights to help businesses unlock the full potential of contract manufacturing. For further inquiries, media requests, and live demonstrations regarding both the “Contract Manufacturing Benefits to Your Process” seminar and the new product launch of STACC to witness the Future of micro fulfillment, please contact CVG directly or visit in person at MODEX 2024 in booth C4489.
Trew unveils new technology and education center
Trew, LLC has introduced its Technology and Education Center (TEC). Located in the company’s Fairfield facility, the TEC serves as a proving ground for research, development, and application testing as well as a training and collaboration space. It enables the company to showcase technologies and engage in discussions with clients and other organizations interested in warehouse and fulfillment automation solutions. Trew’s TEC started limited operations in July of 2023 and has already proven a valuable addition to the company’s portfolio. “The TEC enables us to engage in conversations about the challenges our clients face, opportunities to improve and rethink solutions, and the approaches we can take to win together with clients,” said Trew CEO, Alfred Rebello. The TEC is part of the outcomes of the previously announced R&D Grant from the state of Ohio’s private economic development corporation, JobsOhio: Trew (2023, January 4). Trew Investing in New Technology Center at Southwest Ohio Headquarters [Press release] “Our clients need innovations that fit their business and bring together process, technology, software, and people in a way that helps them thrive. The market is evolving quickly, and we are grateful for the state of Ohio’s economic assistance to accelerate our plans for this center,” continued Rebello. During the first six months of operation, the TEC has been used for application and accelerated product life cycle testing, with millions stress testing cycles. “In addition to collaborating on solutions, the TEC gives us the ability to harden technology and explore innovation ideas,” added Rebello. The TEC is open for client and industry visits. The company plans to continue expanding the TEC with emerging software and partner technologies.
Mid America Paper Recycling will be at MODEX 2024
Mid America Paper Recycling, an independent brokers, processors, and exporters of recovered paper in the Central United Sates, will exhibit at MODEX 2024, March 11-14, at the Georgia World Congress Center in Atlanta, in booth B7054. Mid America will highlight its first-of-its-kind Waste Audit, an initiative focused on tracking and increasing the value of the recycling waste streams generated by logistics firms, commercial printers and paperboard converters. Hosted by The Material Handling Industry of America, the MODEX show/conference will feature advancements in supply chain solutions, materials handling equipment, services, technology and logistics and smart systems. “MODEX 2024 will allow us to educate our customers and attendees about the hidden benefits of their recyclable waste,” explains Don Gaines, CEO of Mid America Paper Recycling. “We plan to do the same with visitors to our booth and explain the tremendous value in adopting a continuous improvement plan for their waste streams.” Mid America works closely with many operations creating a customized, continuous improvement process that identifies where their waste is generated, establishes key collection procedures, and sets objectives that continually improve their waste stream’s revenue contribution to their business. “No other company offers as comprehensive and value-added a solution,” Gaines said. Mid America exhibit staff will be available to fully describe the recycling program, explain its many benefits, how it works, and illustrate why it is a key component for all types of companies, from small and newer businesses to the well-established Fortune 500. The innovative recycling management program helps producers build a scorecard process by benchmarking, monitoring, and continuously upgrading their recycling operations to help them achieve their sustainability goals and grow the financial worth of their waste. “Recyclable materials can be wasted, which doesn’t meet anyone’s environmental goals,” Gaines notes. “But we show companies how their waste can be a significant, value-added contributor to their profitability if professionally managed. We target hidden savings opportunities in an operation’s indirect costs using our innovative Waste Audit process. When we introduce and outline the Audit with plant operations personnel, it gets them thinking, triggering discussion and raising questions.” Mid America shows producers how they can grow the worth of the recyclable waste produced. Gaines says it is an important and detailed process that begins with how the waste is generated and where it flows through a plant, to how loads of the recyclable waste materials are shipped and how all of the steps within the recycling process can be improved to accrue more revenue per ton. Taking Mid America’s free Waste Audit Survey is the first step on the path to recycling improvement. Easy to use, the survey takes only 10 minutes to fill out, but is comprehensive in scope. Because manufacturing operations often create tons of waste each year, – ranging from pre-consumer, high-grade recyclable paper to production trim and paperboard – Mid America’s Audit Process can help these operations realize significant revenues. “Continuous Improvement is so important today in many areas of an operation,” Gaines said. “We designed the Audit to bring this same strategic process to a recycler’s current waste handling practices and build a smart program that continuously improves the worth of their waste.”
Asking the right questions
We ask questions all the time. At work, at home, amongst friends. Often, we ask questions that we already know the answer to, and other times, we ask questions that validate our existing perceptions. But in business, when we’re trying to find answers to complex, layered, multi-faceted problems, we need excellent questions to get the answers and insights we need to make the best decision possible. But we’re usually pretty bad at it. For example, I sat in on a discussion between a CEO and the VP of Sales at a large product company. Sales were flat to plan. The CEO wanted to know why sales were flat and wanted to know how they would reach their 10% revenue growth goal that year. The CEO began with the usual questions – “Why are sales flat?” and “What will it take to reach our growth goal?”. The VP of Sales had the following responses, “We had two territories that missed their targets, and two others that surpassed their goals, making sales flat. But we will reach our growth goal by working more closely with the two lagging territories and get them back to the right trajectory.” This conversation, while appeasing the CEO and making the VP of Sales feel like there was a clear “plan” in place, there is no plan. This is because the right questions weren’t asked. What insight does either party have as to the why? What is the CEO learning that will help them make better decisions going forward? No one is really steering the ship, just riding the waves that already exist. More often than not in this scenario, the high-performing territories will continue to grow, making up the difference of the laggards, and the 10% growth goal will be met. The weak territories will be reshuffled, or those folks will be replaced with a fresh new set of sales personnel. The issue with this is that there’s no transparency to the actual problem. The right questions weren’t asked. Take a different example – say you want to develop a new offering to increase revenue. Do you go and ask customers, “What do you want and need that we don’t offer?” and then simply go and do those things? Do you just pick the things that were within your budget to implement? What happens when revenue doesn’t meet expectations? Because you only asked a surface question and then went directly to implementation, there’s no insight as to why it didn’t work. There’s no insight on what to change, do differently, or eliminate, because you didn’t ask the right questions. Furthermore, not asking the right questions gives you the same answers your competitors are getting. You need to ask deeper, smarter, better questions than the competition to get new and unique insights that drive differentiation, revenue growth, and organizational insight. Asking the same questions as everyone else will get you the same answers as everyone else. To ask the right questions, you need to first identify what you’re trying to understand. This means in both of our examples, what is the real question you have that you want answered? For our CEO and VP of Sales, it’s not “Why are sales flat” but “What issues are impacting the success of our sales team?” For our new offering, the question for customers isn’t “What do you need that we don’t offer” but “What problems do you have that aren’t getting addressed?” The difference is exploratory – opening the door for more opportunities for different insights and perspectives. You want to ask questions that generate further, deeper clarifying questions. You want to ask questions that help you gain new perspectives you hadn’t considered before. You want to ask questions that help you gain insights you can take direct action on and make a clear, measurable business decision. Think about a 4-year-old, who asks relentless questions. They always dig into the “why”. There’s nothing wrong with finding out the why behind things. Utilize curiosity and drive for deeper understanding to create a questioning dialogue. This will help you not only ask the right questions and gain better information for decision-making but also set an example for your team on how to ask the right questions themselves. About the Author Andrea Belk Olson is a keynote speaker, author, differentiation strategist, behavioral scientist, and customer-centricity expert. As the CEO of Pragmadik, she helps organizations of all sizes, from small businesses to Fortune 500, and has served as an outside consultant for EY and McKinsey. Andrea is the author of three books, including her most recent, What To Ask: How To Learn What Customers Need but Don’t Tell You, released in June 2022. She is a 4-time ADDY® award winner and host of the popular Customer Mission podcast. Her thoughts have been continually featured in news sources such as Chief Executive Magazine, Entrepreneur Magazine, Harvard Business Review, Rotman Magazine, World Economic Forum, and more. Andrea is a sought-after speaker at conferences and corporate events throughout the world. She is a visiting lecturer and startup coach at the University of Iowa, a TEDx presenter, and TEDx speaker coach. She is also an instructor at the University of Iowa Venture School. More information is also available on www.pragmadik.com and www.andreabelkolson.com.
Episode 464: Making the most of returns with Patturn’s Innovative Approach to Re-Commerce
In this episode of The New Warehouse Podcast, Dennis Hoang, COO and Co-Founder of Patturn, delves into the innovative world of returns and re-commerce. Patturn is pioneering a shift in how companies manage this challenge, making the process simpler and more efficient. Dennis shares insights into Patturn’s origins, sparked by a personal connection to the challenges faced by small businesses and how these challenges inspired the creation of a comprehensive solution that is Patturn. The Returns Dilemma: Consumer Ease vs. Supply Chain Efficiency Hoang underscores the unique complexities within returns management, driven by its item-specific demands and the substantial variability in returned items. He reveals a critical market void for an all-encompassing solution that adeptly merges technological capabilities with the essential human elements of the returns process. Hoang notes, “On average, 30% of what people buy is being returned…but every retailer makes it easy because they want to keep their customers.” While beneficial for customer retention, this consumer-friendly policy introduces significant operational challenges for retailers. Identifying the need for a solution and an aim to simplify and streamline returns led to the creation of Patturn. The Patturn Return Process Dennis Hoang details Patturn’s comprehensive approach to managing retail returns, emphasizing efficiency and resale optimization. Here’s how Patturn transforms the process: Bulk Inventory Management: Retailers send returns inventory to Patturn by pallet or truckload. Inspection and Tracking: Items go through inspection and receive a unique license plate for tracking purposes. Resale Across Marketplaces: Patturn handles the resale of items across various marketplaces and channels, including their own platforms. Storage and Forward Logistics: Beyond processing and reselling, Patturn manages the storage and forward logistics, streamlining the journey. Hoang highlights the “resale magic” that Patturn leverages, transforming returns into resalable inventory, aka “re-commerce,” thus recapturing value and minimizing waste. Mastering Inventory Management Hoang discusses the importance of aligning inventory with consumer demand, a seemingly straightforward strategy that necessitates a deep understanding of market trends, such as the seasonal popularity of certain products. This approach is fundamental to avoiding stockpiles of unsellable items and ensuring that inventory remains relevant and desirable to consumers. Beyond mere alignment with seasonal trends, Hoang delves into the critical role of analytics and the liquidation of stagnant inventory. From Hoang’s perspective, he believes the rate of returns is likely to increase, even with potential deterrents like return fees. Key Takeaways Patturn is filling a significant gap in the market with its end-to-end returns management solution. The complexity of returns management lies in the item-specific nature of the process, requiring both technological and manual oversight. 30% of products are returned and require effective re-commerce strategies to transform potential losses into opportunities. The New Warehouse Podcast EP 464: Making the Most of Returns with Patturn’s Innovative Approach to Re-Commerce
The ARA Show heads west to Las Vegas in 2025
Next year, The ARA Show™ will head back to Las Vegas and the Las Vegas Convention Center. A full day of education will begin the show on Wednesday, Jan. 29, followed by the three-day trade show from Thursday, Jan. 30, through Saturday, Feb. 1. Future of Equipment Rental will return in 2025 and take place on Tuesday, Jan. 28 As planning begins for 2025, attendees and exhibitors should note the change in days of the week from a typical show to the Wednesday-Saturday schedule the show will be on in Las Vegas. The desert of Las Vegas has been a long-time favorite for attendees with the fun, nightlife, and bright lights of the city. Las Vegas continues to grow in excitement and the American Rental Association (ARA) looks forward to bringing the show back to Vegas in 2025, following a successful return in 2021. More details about The ARA Show 2025 will be available in the coming months. Check out ARAshow.org and the show’s social media channels for the latest information.
Gordon Report: The current U.S. Labor-market conundrum
The February 2024 BLS jobs report showed a surge of 353,000 jobs added in January, more than double than what was predicted in economic surveys. This follows a gain of 330,00 jobs in December. Another surprise in this February report is that average hourly wages grew rather than holding steady. Over the past year, they have grown 4.5 percent. What factors may be behind these unexpected numbers? An average of 10,000 workers from the large baby-boomer population have been retiring each day. This year the average will grow as the baby-boomer retirements peak. This flood of retirees will continue until 2030. Therefore, this year and until the end of this decade, many job openings will arise from the need to replace retirees. In at least some sectors of the economy, it appears that employers are raising wages to find workers with the skills they need. Chief Economist Bill Dunkelberg of the NFIB (an association of small business owners) reported on their January survey, “Owners continue to raise compensation to retain and attract workers with the skills and willingness to do the job, but hiring remains a struggle in a tight labor market.” So far, this strategy has not been very successful. In that same survey, 39 percent of the respondents reported having unfilled job openings. Members of the Association of General Contractors also have high levels of unfilled jobs despite providing a wage premium of almost 19 percent over that of the average for private-sector production employees. In some cases, higher wages may attract people who have not been participating in the labor force to seek a job if the pay level would offset the costs of childcare, a long commute, or obtaining additional training. A recent Korn Ferry survey of job seekers, however, found that many applicants do not have the skills required for open jobs. In some cases, this is due to the development of new types of jobs with recently updated skill sets. The above data points to a current labor market with a significant skills-jobs mismatch. However, the Training Industry Annual Survey of 2023 reported that business investment in employee training remained flat. Going forward, predictions are that companies will cut their training budgets. The irony is that one way or the other business will have to pay more to find skilled workers either through continuing to raise wages or by investing in more in-house or collaborative training programs. About the Author: Edward E. Gordon is the founder and president of Imperial Consulting Corporation in Chicago. His firm’s clients have included companies of all sizes from small businesses to Fortune 500 corporations, U.S. government agencies, state governments, and professional/trade associations. He taught in higher education for 20 years and is the author of numerous books and articles. More information on his background can be found at www.imperialcorp.com. As a professional speaker, he is available to provide customized presentations on contemporary workforce issues.
US Cutting Tool orders totaled $187.9 Million in December 2023 which brings the Year-to-Date total up 6.9% from 2022
December 2023 U.S. cutting tool consumption totaled $187.9 million, according to the U.S. Cutting Tool Institute (USCTI) and AMT – The Association For Manufacturing Technology. This total, as reported by companies participating in the Cutting Tool Market Report collaboration, was down 7.3% from November’s $202.7 million and down 0.3% when compared with the $188.4 million reported for December 2022. With a year-to-date total of $2.45 billion, 2023 is up 6.9% when compared to the same period in 2022. “With 2024 comes change and challenge,” stated Steve Boyer, president of USCTI. “The U.S. cutting tool industry will continue to see growth opportunities in aerospace, automotive, medical, and computer-related segments but slowing and declines in other markets. While forecasts initially anticipated interest rate declines as we moved into 2024, recent inflation indicators appear to temper those expectations. We enter the new year with a guarded view anticipating continued challenges and uneven growth.” Mark Killion, director of U.S. industries at Oxford Economics, added: “After a strong start to 2023, shipments of cutting tools weakened in the last quarter of the year, falling 7.3% in December. As a result, shipments ended the year near their 2022 levels.” The Cutting Tool Market Report is jointly compiled by AMT and USCTI, two trade associations representing the development, production, and distribution of cutting tool technology and products. It provides a monthly statement on U.S. manufacturers’ consumption of the primary consumable in the manufacturing process – the cutting tool. Analysis of cutting tool consumption is a leading indicator of both upturns and downturns in U.S. manufacturing activity, as it is a true measure of actual production levels. Historical data for the Cutting Tool Market Report is available dating back to January 2012. This collaboration of AMT and USCTI is the first step in the two associations working together to promote and support U.S.-based manufacturers of cutting tool technology. The graph below includes the 12-month moving average for the durable goods shipments and cutting tool orders. These values are calculated by taking the average of the most recent 12 months and plotting them over time.
January 2024 drops 15% with Planned Industrial Construction Projects in one month
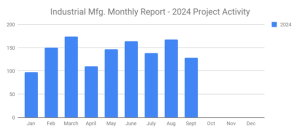
Research by SalesLeads’ experienced industrial market research team, shows 369 new planned industrial projects tracked during the month of January. Planned industrial project activity decreased 15% from the previous month. The following are selected highlights on new industrial construction news and project opportunities throughout North America. Planned Industrial Construction – By Project Type: Manufacturing Facilities – 90 New Projects Processing Facilities – 103 New Projects Distribution and Industrial Warehouse – 191 New Projects Power/Energy/Oil and Gas – 4 New Projects Laboratory Facilities – 10 New Projects Mine – 0 New Projects Terminal – 1 New Project Pipeline – 0 New Projects Planned Industrial Construction – By Scope/Activity New Construction – 177 New Projects Expansion – 83 New Projects Renovations/Equipment Upgrades – 120 New Projects Plant Closing – 23 New Projects Planned Industrial Construction – By Location (Top 10 States) Texas – 28 Florida – 27 New York- 23 California – 22 North Carolina – 19 Indiana – 16 Michigan – 16 Ohio – 15 Wisconsin – 13 Georgia – 12 Largest Planned Industrial Construction Project During January, our research team identified 30 new General Industrial facility construction projects with an estimated value of $100 million or more. The largest project is owned by Pathways Alliance, which is planning to invest $17 billion in the construction of a carbon capture and storage facility in WOOD BUFFALO, AB. They are currently seeking approval for the project. Top 10 Tracked Industrial Construction Projects ONTARIO: Automotive MFR. is considering investing $14 billion for the construction of an EV battery manufacturing facility and currently seeking a site in ONTARIO. ALBERTA: Oil and gas company is planning to invest $3 billion for the construction of a processing facility in WOOD BUFFALO, AB. They are currently seeking approval for the project. Construction will occur in two phases. MISSISSIPPI: Energy technology company is planning to invest $2 billion for the construction of an EV battery manufacturing facility in MARSHALL COUNTY, MS. They are currently seeking approval for the project. OKLAHOMA: Lithium producer is planning to invest $1.2 billion for the construction of a processing facility in MUSKOGEE, OK. They are currently seeking approval for the project. Construction is expected to start in Summer 2024. TEXAS: Renewable energy company is planning to invest $1 billion for the construction of an ammonia processing facility in PORT ARTHUR, TX. They are currently seeking approval for the project. NEBRASKA: Renewable energy company is planning to invest $650 million for the construction of an ammonia processing plant in AURORA, NE. They are currently seeking approval for the project. Construction is expected to start in early 2025, with completion slated for late 2026. NORTH CAROLINA: Diesel engine MFR. is planning to invest $580 million for the expansion and equipment upgrades on their manufacturing facility in WHITAKERS, NC. They are currently seeking approval for the project. ARKANSAS: Oil and gas service company is planning to invest $500 million for the construction of a bromine processing plant in COLUMBIA and LAFAYETTE COUNTIES, AR. They have recently received approval for the project. ILLINOIS: Copper products MFR. is planning to invest $500 million for the expansion and equipment upgrades on their manufacturing facility in EAST ALTON, IL. They are currently seeking approval for the project. CALIFORNIA: Semiconductor MFR. is planning to invest $432 million for the construction of a manufacturing facility in WEST OAKLAND, CA. They are currently seeking approval for the project. About Industrial SalesLeads, Inc. Since 1959, Industrial SalesLeads, based in Jacksonville, FL is a leader in delivering industrial capital project intelligence and prospecting services for sales and marketing teams to ensure a predictable and scalable pipeline. Our Industrial Market Intelligence identifies timely insights on companies planning significant capital investments such as new construction, expansion, relocation, equipment modernization, and plant closings in industrial facilities. The Outsourced Prospecting Services, an extension to your sales team, is designed to drive growth with qualified meetings and appointments for your internal sales team.