Gordon Report: Welcome to “Twilight Zone 2022”
Across America, unnerving and disruptive economic and social shifts are causing confusion and anxiety. We are living in a new “Twilight Zone.” Many surprises lie ahead in 2022. The shrinkage of the $8.76 trillion Federal Reserve portfolio will raise interest rates as inflation soars. As cheap money ends, expect a major stock market correction. Real GDP growth is slowing. It only rose 1.9 percent between 2019 and 2021. By the end of 2022 expect GDP to only be $21.5 trillion. This is dwarfed by $30 trillion in total U.S. government debt. As interest rates rise, paying all that debt will squeeze the federal budget. There is no free lunch. Retirements will soar. In 2022 the largest cohort of baby boomers will turn 65. Population growth is at record lows – only 0.1 percent in 2021. This plus stepped-up retirements will lead to growing job vacancies in 2022. Long-term unemployment will continue to be high for prime-age workers (ages 25 to 54). The causes include COVID-19 risks, inability to find affordable childcare, education and skill deficits, and lack of access to job training. Business training investment will be forced upward as job vacancies escalate. Some companies have already announced major initiatives. Intel is committing $100 million to train and development of workers for two chip factories to be built outside Columbus, Ohio. To combat persistent pilot shortages that have forced route reductions, United Airlines has launched its own training program for pilots, the Aviate Academy in Goodyear, California. In 2021 according to Federal Reserve estimates, U.S. businesses lost over $700 billion due to skilled job vacancies. This number will rise in 2022. If the United States is to emerge from the 2022 Twilight Zone over this decade, addressing skilled labor deficiencies is an urgent priority. Multisector initiatives can more effectively coordinate education and training programs. Students need more information on career options and the educational preparation needed for them. Workers need retraining to acquire the specific skills needed for jobs in today’s high-tech offices and factories. About the Author: Edward E. Gordon is the president and founder of Imperial Consulting Corporation.
January 2022 Logistics Manager’s Index Report®
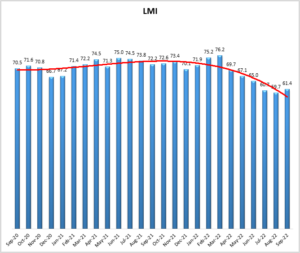
LMI® at 71.9 Growth is INCREASING AT A DECREASING RATE for: Inventory Levels, Inventory Costs, Warehousing Utilization Warehousing Prices, and Transportation Prices Growth is INCREASING AT AN INCREASING RATE for: Transportation Utilization Warehousing Capacity and Transportation Capacity are CONTRACTING January’s reading of 71.9 is up (+1.8) from December’s reading of 70.1. The marks a full year of growth rates above 70.0 – a level we would classify as significant expansion. The only two months of the last 17 in which we saw sub-70.0 growth were in December 2020 and January 2021 which was largely a function of the seasonal wind-down of inventories. This year we’re seeing the opposite, as January’s Inventory Levels read in a 71.1 – the highest rate of growth since early 2018. In December we noted that inventories remained high upstream, speculating that we may be seeing significant inventory that was ordered for the holiday season continue to flow through supply chains even after Q4 was over. This month’s report offers more evidence that this is the case, as now Upstream and Downstream respondents report significant levels of inventory growth. The unseasonable expansion of inventory may be creating a positive feedback look with the logistics capacity and cost issues that plagued 2021. Because capacity is low and costs are high, it is difficult to move inventory efficiently. This combination of low capacity and high costs likely led to over-ordering this past Fall, and to goods idling at points in the supply chain where they could not be purchased by customers. Excess inventory in the system is eating up more capacity and causing costs to increase further. Essentially, low capacity and high costs led to higher levels of inventory, and now higher inventory is leading to even less capacity and higher costs. The result of this is that the high levels of inventory of durable goods in the supply chain are eating up capacity, and preventing high-turn inventories from moving as quickly as they need to which explains why some firms (i.e. apparel) are weighed down with inventory, and others such as grocery stores are facing shortages. Much like diets and gym memberships, January is a time of renewal in supply chains, allowing logistics networks to reset post-holiday. After this reset, firms can then began ramping back up for demand throughout the year. This year, activity is already elevated in January. It will be interesting to observe the next 12 months, and whether this portends continued growth, or if the price will be too high eventually be too high for demand to continue to grow. Researchers at Arizona State University, Colorado State University, Rochester Institute of Technology, Rutgers University, and the University of Nevada, Reno, and in conjunction with the Council of Supply Chain Management Professionals (CSCMP) issued this report today. Results Overview The LMI score is a combination of eight unique components that make up the logistics industry, including inventory levels and costs, warehousing capacity, utilization, and prices, and transportation capacity, utilization, and prices. The LMI is calculated using a diffusion index, in which any reading above 50 percent indicates that logistics is expanding; a reading below 50 percent is indicative of a shrinking logistics industry. The latest results of the LMI summarize the responses of supply chain professionals collected in January 2022. Overall, the LMI is up slightly (+1.8) from December’s reading of 70.1. The growth in this month’s index is fueled by metrics from across the index. Unseasonably high rates of inventory accumulation stand out among these metrics, but capacity remains constrained, and prices continue to grow quickly. Looking forward, respondents do not predict much relied over the next 12 months. Given the current shortages in capacity, it is difficult to disagree with them. The start-stop nature of economic activity during a pandemic continues into 2002. In a turn from the hot consumer market we saw through much of 2021, U.S. spending was down 0.6% in December[1]. This is likely one of the drivers behind growing inventory levels. Firms that had stocked up anticipating a continuation of the hot consumer economy we observed throughout the Fall may now be facing the opposite problem, with more inventory than needed to meet demand. Reacting to this shift, Bank of America has decreased its expectations for first-quarter US GDP growth to only 1%. Originally, they had predicted 4% growth. The Atlanta Federal Reserve predicts a meager 0.1% growth in the 4th quarter. Reduced growth predictions are partially due to the continued spread of Omicron[2]. It is also possible that decreased consumer spending and increased firm expenses will put a crimp on the economy. This is likely due to the Omicron spike that raged throughout the US in December and January, a continued lack of logistics capacity that made some sales impossible, and a decrease in consumer savings that – after peaking in March – are now back down to pre-COVID levels, indicating that much of the stimulus has been worked through at the consumer level. Despite this slowdown, logistics professionals are bullish on continued growth in 2022[3]. Continued growth is likely a safe assumption as the lack of logistics capacity is one of the primary reasons consumer activity was down. For example, December volumes at the ports of LA and Long Beach were down 14% year over year[4], and LA Signal reports that volumes for the last week of January were down 19.3% year over year. Throughput continues to drop despite the 100-ship backlog off the Southern California ports. Conversely, the first two weeks of February are predicted to be up 66% and 38% respectively year-over-year[5]. This continues an interesting pattern in which future bookings for the Port of LA are much higher than in 2021, but then the volume that is actually processed turns out to be much lower. Essentially, the highly-reported increases in throughput at the ports were largely driven by gains in the first half of the year, before the lack of capacity ground everything to a halt[6]. And congestion at the ports is
U.S. Rail Traffic for the week ending February 12, 2022
The Association of American Railroads (AAR) has reported U.S. rail traffic for the week ending February 12, 2022. For this week, total U.S. weekly rail traffic was 504,482 carloads and intermodal units, up 5 percent compared with the same week last year. Total carloads for the week ending February 12 were 236,457 carloads, up 11.9 percent compared with the same week in 2021, while U.S. weekly intermodal volume was 268,025 containers and trailers, down 0.4 percent compared to 2021. Seven of the 10 carload commodity groups posted an increase compared with the same week in 2021. They included coal, up 14,634 carloads, to 69,021; nonmetallic minerals, up 5,315 carloads, to 28,262; and farm products excl. grain, and food, up 2,022 carloads, to 16,911. Commodity groups that posted decreases compared with the same week in 2021 were petroleum and petroleum products, down 345 carloads, to 9,673; motor vehicles and parts, down 305 carloads, to 13,659; and miscellaneous carloads, down 282 carloads, to 9,649. For the first six weeks of 2022, U.S. railroads reported a cumulative volume of 1,357,008 carloads, down 0.8 percent from the same point last year; and 1,509,334 intermodal units, down 11.8 percent from last year. Total combined U.S. traffic for the first six weeks of 2022 was 2,866,342 carloads and intermodal units, a decrease of 6.9 percent compared to last year. North American rail volume for the week ending February 12, 2022, on 12 reporting U.S., Canadian and Mexican railroads totaled 329,598 carloads, up 9.3 percent compared with the same week last year, and 350,974 intermodal units, down 0.1 percent compared with last year. Total combined weekly rail traffic in North America was 680,572 carloads and intermodal units, up 4.3 percent. North American rail volume for the first six weeks of 2022 was 3,879,720 carloads and intermodal units, down 7.8 percent compared with 2021. Canadian railroads reported 72,963 carloads for the week, up 5.2 percent, and 67,484 intermodal units, up 4.7 percent compared with the same week in 2021. For the first six weeks of 2022, Canadian railroads reported a cumulative rail traffic volume of 793,071 carloads, containers, and trailers, down 12.2 percent. Mexican railroads reported 20,178 carloads for the week, down 3.6 percent compared with the same week last year, and 15,465 intermodal units, down 12.4 percent. Cumulative volume on Mexican railroads for the first six weeks of 2022 was 220,307 carloads and intermodal containers and trailers, down 2.5 percent from the same point last year. To view the weekly U.S. Traffic charts, click here.
Translating research into Actionable Strategy
I’ve seen hundreds of customer and competitive research documents, with pages upon pages of excellent data, qualitative feedback, facts, and figures. These documents are often presented to organizational leadership, who skim through the pages and pull out a few key questions on specific points for clarification and discussion. Those meetings always go well, with the executive team complimenting the thoroughness and value of the research, noting the time and effort put in, and everyone leaves on a proverbial high. We now have the information we need to develop a clear strategy – or do we? The problem comes post-meeting. Those documents are pushed to the side in the weeks to come, where strategy meetings and discussions continue to churn on those biggest pain points in the organization, and new ideas are tossed about. Maybe the data is referred to here and there but isn’t directly put into action. Why? Maybe stakeholders don’t see the true value of the research, or they don’t make the best decisions with the data given, or they automatically assume the fault lies with the data itself. I’d argue, it’s not the data, and it’s not the leadership. It’s the gap between them. Now maybe you’d say a reason why stakeholders might not translate information into action is that these reports aren’t the most engaging of materials to read, and when stakeholders need to make a decision at the moment, leafing through a long wordy report to find the right data point to help just won’t happen. No question this is an influencing factor, and in the last few years, research reporting has undergone a substantial revolution. There are now multiple ways of reporting that capture stakeholders’ attention: for example, using video, newsletters, and posters to create bite-sized delivery systems so stakeholders can quickly read them and easily find specific data points. However, this improved delivery of information is only one piece of the puzzle. The real problem is that of insight. Research primarily provides information on “what is”, or the current state of affairs. 60% of customers prefer this product. 26% of customers surveyed want digital rather than in-person options. The number of applications has increased 15% year over year. Ok, this is all good and well. The question is, so what? What does that mean, and more importantly, what do we do with it? The gap is insights. Insight is the understanding of a specific cause and effect within a particular context. Data isn’t insights. Commentary isn’t insights. Product comparisons aren’t insights. It’s information. Insights are much harder to produce, and many times, executives expect their research teams to generate insights, while the research teams believe it’s the leadership’s responsibility to draw insights from the data. It’s like a Mexican standoff. Consider this scenario. A book publisher is looking to grow its readership base. This is their “high level” objective. Wonderful! So they have their team conduct research on other publishers, identifying trends in genres and best-selling titles. They also dive into customers’ reading habits, including where/when they read, how they read, how they pick a book, and so forth. Fantastic! The data is presented to the executive team, where there’s active discussion and commentary about some interesting facts, such as almost 40% of readers still prefer printed books. Interesting! Now what? Where does the company go from here? This is the insight problem. We’re looking for some eureka moment that doesn’t come. The research alone cannot generate a specific understanding of a cause and effect or draw connections between disparate data points. We need to generate insights and this requires human intervention. What separates the winners from the losers is the ability to transform data into insights and to turn those insights into an actionable strategy. Insights can’t be created by a recipe or rigid methodology. Insight requires thinking holistically, exercising creative, right-brain skills as well as left-brain analytics – in short, whole-brain thinking. Insight must also be business-focused, always considering ways and means for generating organizational growth. This begins with scenario-telling. Walking through experiences as a customer would, exploring behaviors, their catalysts, and barriers. For example, instead of simply reporting how, say, seniors struggle with products, articulate and simulate a scenario of how hard it might be to read the label on a product, such as toothpaste. This provides both leaders and researchers with a better understanding of human behaviors and obstacles people may face. This connection arc helps make all the difference. Instead of reading a report outlining X% of consumers prefer brand A over brand B, examine scenarios. Dive into behaviors and discuss perceptions. Gleaning insight isn’t simply about examining information on current behaviors, but understanding the why behind those behaviors. Going back to our book publisher example, the team utilized scenario-telling to identify that readers were often interrupted throughout their day, and had difficulty blocking out long chunks of time for reading, even though they enjoyed it. While the research alone uncovered topics, authors, and genres of interest, it couldn’t uncover this behavior. In turn, the company created a series of serialized stories, one short 600–5,000 word episode at a time, to reach a whole new audience of mobile-first, on-the-go readers. Readers could follow the stories they’re invested in, let the author know they liked it with “thumbs up”, and redeem tokens to unlock future episodes. Now that’s creating real insight and turning it into business generation. About the Author: Andrea Belk Olson is a speaker, author, applied behavioral scientist, and customer-centricity expert. As the CEO of Pragmadik, she helps organizations of all sizes, from small businesses to Fortune 500, and has served as an outside consultant for EY and McKinsey. Andrea is the author of The Customer Mission: Why it’s time to cut the $*&% and get back to the business of understanding customers, No Disruptions: The future for mid-market manufacturing, and her upcoming book, What To Ask, coming in June 2022. She is a 4-time ADDY® award winner and host of the popular Customer Mission podcast. Her thoughts have been continually featured in news
Inflation – OMG!
In December of 1980, I left college and got my first full-time job. We had just elected Ronald Reagan in a landslide election, but Jimmy Carter was still the President. The hostages in Iran had been held captive for over 400 days. The unemployment rate was eight percent. Our economy was facing runaway inflation. Nobody knew quite what to do, or what to expect next. In 1976, the inflation rate was 4.6%. Four years later it had skyrocketed to 12.5%. The Federal Reserve uses interest rates as their primary tool to stem the tide of dollars flowing into the marketplace and bring inflation back under control. In the six-month period from June to December of 1980, the federal funds rate was raised six consecutive times, starting at 8.5% and topping out at 20%. The prime rate in December was an astronomical 21.5%. It was a portentous moment to start a career. The standing joke of the day was: “I dozed off for a moment…. did the prime rate go up while I was asleep?” We only laughed to keep ourselves from crying. Only people born before 1960 were affected by (or even remember) this near-catastrophic economic upheaval. Ronald Reagan re-ignited the economy using tax cuts, deregulation, and incentives. Life went on…prosperity returned. That was 40 years ago. 40 years is a long time. How quickly we forget the tenuous economic legs on which we stand. For the rest of the ’80s and most of the 1990s, we were able to enjoy a robust economy, while maintaining control over the money supply. Rates were moderated with the FOMC occasionally adjusting federal funds rates which averaged between 3.0 – 5.0% through the mid-2000s. Then in 2008, an unprecedented banking crisis nearly took the country into a deep depression. Credit tightened, as banks had to adjust to new regulatory parameters. The Federal Reserve, in an effort to soften the severity of the economic impact, started printing money (using the bond market and a new euphemism called “quantitative easing”). They also lowered the fed funds rate to spur borrowing of those printed dollars, in an effort to get the economy moving again. All of this phantom liquidity caused some concern. Rewind to 1980. Too many dollars, chasing too few goods equals inflation. Surprisingly…inflation did not materialize. So, the Fed lowered rates again…and again…and again. From a high of 5.25% in June of 2006 to a low of 0.25% in December of 2008. For the next 13 years (with a few notable exceptions), the government has kept printing money and making it available to banks at nearly zero net cost. This left many (myself included) scratching their heads about the mathematics connected to economic inflation. The banks, the investment firms, the government bailouts, the low-cost loans, and even a worldwide pandemic could not seem to stir the inflationary beast. Funny thing about inflation; by the time you figure out it’s started… it’s already out of control. Well, it seems the wildfire has been started…on a very windy day. The supply chain crisis has finally kicked us over the edge of the inflationary cliff. All of the printed dollars circulating in the economy have fewer and fewer places to go. Cars, machinery, real estate, clothing, food staples, gasoline, building materials, and nearly every other consumer and commercial category are facing rising prices as demand increases, and supply shrinks. In January of 2021, the CPI inflation index was at 1.4%. It DOUBLED two months later (Mar 21 -2.6%). Then it doubled AGAIN on May 21 (5.0%). At this writing, the numbers for November were just published at a staggering rate of 7%. Ships are still waiting to unload at the ports, shortages are becoming commonplace, and makers of microchips are still reporting lead times that extend well into 2023. Yes…. we need microchips to build forklift trucks. Inflation is not “on the horizon”. It’s not “transitory”. It’s here…it’s real and as dealers, we are directly affected by it. For the past 40 years, we have not really had to deal with spiking prices. Our SOP’s, our pricing policies, our workforce, and our customer service processes will all need to be reviewed. Our success in 2022 and beyond will in great measure, be predicated on the decisions we make NOW regarding inflationary pressure. In this article, I want to suggest a few key areas where we need to prepare the management team ahead of this expanding price wave. Doing so will ensure that we maintain adequate profitability as well as long-term customer retention. New Equipment Sales My wife and I just purchased a new vehicle a couple of months ago. Have you been to a car lot lately? What did you see? New cars? No, you didn’t. You saw USED cars. That’s because every dealership in the country is waiting on their inventory from the factory…. just like we are. Of the model we were interested in… they had a total of two in inventory. We were quoted a full sticker price PLUS $4,000 if we wanted to drive it off the lot. No deals. No discounts. They knew exactly how many new cars they were apportioned, and exactly what they had to sell them for in order to remain in business. They didn’t really care if we bought it or not, because someone would….and quickly. We wanted it, so we paid for it. We also knew that to find another one, we would have to drive over 100 miles, and pay the same price. So, our options were limited because the INVENTORY was limited. Can you sell your new lift truck inventory on the yard for the list price? Perhaps not…. But you need to understand the power that scarcity gives us. As a sales manager, I can’t ignore the fact that we may be out of stock by the time the trees are in bloom. Every dealer has a minimum profit percentage for a new forklift deal. Raise the floor on that expectation NOW. Announce
EP 254: German Bionic
On this episode, I was joined by the Head of IoT at German Bionic, Norma Steller. German Bionic is focused on making smart exoskeletons to help workers specifically in the logistics sector be more ergonomic. We discuss why this need is so important, the Cray X Power Suit, and how it helps improve your employees’ health over time. Key Takeaways There are multiple different exoskeletons on the market right now and they have definitely been coming on my radar lately since I saw a few on my visit to the DHL Innovation Center so I was very eager to learn more about German Bionic’s offering. While robots and automation are certainly on the rise, Norma is sure to point out that we are far from having robots take over everyone’s job and we will need people to work for many years to come. With this notion, German Bionic set out to develop their exoskeleton offerings. They are currently on their fifth generation which has gone over some overhauling from user feedback which they take very seriously because if they do not provide something comfortable and useful then it will just end up getting covered in dust. The Cray X power suit is the latest offering from German Bionic and as Norma describes it, is like having a robot on your back. The device straps to your back and has support for you to be able to lift up to 66 pounds with minimal effort. This helps to reduce the amount of exertion being done in each lift which saves your body and ultimately results in higher productivity. Additionally, the Cray X offers walking assistance which makes it the first on the market to have two support systems in one. There are tons of steps being done every day by workers in the logistics field so being able to reduce the amount of energy put out in these steps helps to reduce the fatigue of that worker. As Norma’s title suggests, they are very focused on the device being connected as well. The device is able to generate multiple data points that can help you to better understand how your workers are moving and in turn how you can help improve their working conditions for better overall output. With this data, German Bionic is also able to understand how their products are working and more importantly where they are lacking. Using their data they have been able to really understand how to improve their device to make a product that workers want to use and feel comfortable with. The New Warehouse Podcast EP 254: German Bionic
Women In Trucking Association launches Index Survey to collect Gender Diversity data
The Women In Trucking Association (WIT) is encouraging companies in transportation to complete a survey that collects data on gender diversity in the industry. The data will be used to develop this year’s version of the WIT Index, which is the official industry barometer to regularly benchmark and measure the percentage of women who are professional drivers, in corporate positions, and serve on boards of directors. WIT is requesting for-hire trucking companies, private fleets, transportation intermediaries, railroads, ocean carriers, equipment manufacturers, and technology companies to report the percentage of women in various roles of their workforce include. Data reporting will be kept strictly confidential and data will be reported only as aggregate totals of respondents. Individuals completing the survey must be an authorized respondent from the company. Interested participants can report their data via the live survey through April 1, 2022, at www.womenintrucking.org/index. Participating companies in the survey will receive at no cost an executive summary of the 2022 WIT Index, which will enable them to benchmark their gender diversity practices against other companies in transportation. Monitoring gender diversity in a male-populated industry like transportation is critical so that statistically valid data can be used to evaluate progress made in this area. “By ensuring we have gender diversity in the marketplace, our overall industry benefits from increased creativity and innovation,” said Ellen Voie, president and CEO of WIT, who spearheaded the launch of the first WIT Index in 2016. “Through more gender diversity, individual companies also can ultimately tap into more people who have the right skill sets and talents they need in their workforce.” This year, WIT has expanded its collection on the percentage of women in additional functional roles, including operations, technicians, human resources and talent management, and marketing. The WIT Index was last published in 2019 through a collaboration with FreightWaves, a company known for its data analytics and actionable market insights to the industry.
U.S. Rail Traffic for the week ending February 5, 2022
The Association of American Railroads (AAR) has reported U.S. rail traffic for the week ending February 5, 2022. For this week, total U.S. weekly rail traffic was 458,152 carloads and intermodal units, down 7.6 percent compared with the same week last year. Total carloads for the week ending February 5 were 218,286 carloads, down 3.6 percent compared with the same week in 2021, while U.S. weekly intermodal volume was 239,866 containers and trailers, down 11 percent compared to 2021. Two of the 10 carload commodity groups posted an increase compared with the same week in 2021. They were coal, up 4,682 carloads, to 64,582; and chemicals, up 348 carloads, to 33,921. Commodity groups that posted decreases compared with the same week in 2021 included motor vehicles and parts, down 4,614 carloads, to 10,432; grain, down 2,569 carloads, to 23,517; and petroleum and petroleum products, down 2,315 carloads, to 9,148. For the first five weeks of 2022, U.S. railroads reported a cumulative volume of 1,120,551 carloads, down 3.1 percent from the same point last year; and 1,241,309 intermodal units, down 14 percent from last year. Total combined U.S. traffic for the first five weeks of 2022 was 2,361,860 carloads and intermodal units, a decrease of 9.1 percent compared to last year. North American rail volume for the week ending February 5, 2022, on 12 reporting U.S., Canadian and Mexican railroads totaled 308,622 carloads, down 4.4 percent compared with the same week last year, and 318,404 intermodal units, down 10.6 percent compared with last year. Total combined weekly rail traffic in North America was 627,026 carloads and intermodal units, down 7.6 percent. North American rail volume for the first five weeks of 2022 was 3,199,148 carloads and intermodal units, down 10 percent compared with 2021. Canadian railroads reported 69,102 carloads for the week, down 10.5 percent, and 63,418 intermodal units, down 10.5 percent compared with the same week in 2021. For the first five weeks of 2022, Canadian railroads reported a cumulative rail traffic volume of 652,624 carloads, containers, and trailers, down 15.2 percent. Mexican railroads reported 21,234 carloads for the week, up 9.9 percent compared with the same week last year, and 15,120 intermodal units, down 4.4 percent. Cumulative volume on Mexican railroads for the first five weeks of 2022 was 184,664 carloads and intermodal containers and trailers, down 1.4 percent from the same point last year. To view the U.S. Rail Traffic charts, click here.
Jim Indelicato Material Handling Scholarship announced
The Material Handling Education Foundation, Inc. (MHEFI) and MHI member Agile Business Media, Publishers of DC Velocity Magazine, and CSCMP’s Supply Chain Quarterly, recently announced the successful launch of “The Jim Indelicato Material Handling Scholarship.” “We face a labor shortage today that is not going away any time soon,” said Gary Master, president of Agile Business Media. “It is our job as leaders to assist in training and developing our next wave of talent that the world desperately needs to keep our supply chains operating smoothly. Remembering Jim’s passion for this industry and by assisting in its future development is the best way we can properly remember Jim and honor his contributions.” Scholarships will be awarded to students majoring in related fields in the amount of $1,500.00 each for the first year. To contribute to this fund, visit mhi.org/mhefi/donors. For more information about the scholarship program, contact Donna Varner at the Material Handling Education Foundation at 704-676-1190 or Gary Master at 412-596-7387. The Material Handling Education Foundation, Inc. (MHEFI) is an independent charitable organization that was established in 1976. Since 1976, our programs have supported over 1,000 students and educators seeking pathways to quality educational programs and fulfilling careers. The demands of today’s global economy and fast-paced technological change reinforce the need to draw top talent to sustain and strengthen material handling and supply chain businesses for the future.
MHI announces MODEX 2022 Innovation Award finalists
MHI just released the list of finalists for the 2022 MHI Innovation Award. After receiving 121 submissions for this year’s awards, five independent judges comprised of professionals from the material handling and supply chain industry completed the initial review process. Four finalists were chosen as the most innovative products in each category – Best New Innovation; Best Innovation of an Existing Product; and Best IT Innovation based on concept, value, and impact. Best New Product Finalists: Beckhoff Automation for XPlanar Boston Dynamics for Stretch Exotec for The Skypod System Phantom Auto for Remote Operation Platform Logistics Best Innovation of an Existing Product Finalists: Ancra Systems B.V. for Skateloader System AutoStore for Grocery Micro Fulfillment Center (MFC) Solution ProGlove for MARK Display Rufus Labs, Inc. for Rufus WorkHero: Superhuman Platform for Supply Chain Best IT Innovation Finalists: SVT Robotics for The SOFTBOT® Platform, from SVT Robotics Systems Loading Dock Equipment for myQ Dock Management Veryable, Inc. for On-Demand Labor Marketplace Yard Management Solutions for Yard Management Solutions The MHI Innovation Award serves to educate and provide valuable insights on the latest manufacturing and supply chain products and services to MODEX attendees. MODEX 2022 exhibitors were called to submit a new product, product line, technology or service, or new application of existing products or technology that creates quantifiable and sustainable results in terms of ROI, cost savings, and customer satisfaction. On Monday, March 28, 2022, finalists will present their unique solutions to a panel of judges on the show floor at MODEX 2022. The winners in each category will be announced at MODEX 2022 on March 30th during MHI Industry Night with Preacher Lawson. MHI would like to thank the five judges for graciously volunteering their time as Innovation Award judges.
EP 252: Battery Talk 2022
On this episode, I was joined by not one but five guests! I call this one battery talk because we were talking batteries for the latest edition of Material Handling Wholesaler magazine which focuses on lithium-ion batteries in our industry. I was joined by Harold Vanasse of Enersys, Robin Schneider of Greencubes Technology, John Gelsimino of Arcon Equipment, David Suarez of One Charge, and Chris French of PowerBattUSA. We discuss the current state of batteries in the material handling industry including challenges with lithium-ion and sustainability of lithium-ion. Key Takeaways Overall the consensus from all guests was that lithium-ion is pushing its way into more operations but it is still incredibly early in the adoption cycle. While there are certainly benefits to lithium-ion the technology is still developing to the point where there are still some unanswered questions because we have just not had to cross that bridge yet. In the discussion, we touch on many of these unanswered questions and it seems the overall opinion is that we are heading in the right direction to make sure that lithium-ion gets on the right track. However, all guests were on the same page with that we will not see a total lithium-ion takeover and lead-acid will still be present in the industry 10 years from now. Some of the challenges that were raised include the sustainability of lithium-ion and the cost of entry. Right now due to lithium-ion being such a young technology for our industry there has not really been a fully developed recycling program or way to properly dispose of the batteries. Currently, they are being repurposed but the end of life has not necessarily been determined or been determined in a way that makes economic sense for all parties involved. Another point to sustainability that Chris brought up was how long will the actual supply of natural resources that lithium-ion needs last. With many things now requiring these resources to operate there may be a shortage at some point. While the total cost of ownership can be greatly reduced by switching to lithium-ion the cost of entry is very high. Most operations can not afford to switch over at once due to this which slows down the adoption of lithium-ion as many businesses do not have the resources for this. Additionally, the benefits can be the reduced amount of maintenance on these batteries but Harold points out that new forms of lead-acid are also becoming available in the market that is maintenance-free so it will be interesting to see how the market develops over the next few years. Listen to the episode below and leave your thoughts in the comments. The New Warehouse Podcast EP 252: Battery Talk 2022
Three Chronic Leadership Blind Spots Thwarting Success
Organizational leaders aren’t infallible. They make mistakes. They miss things. They have blind spots. Sometimes blindspots are easy to reveal, while others persist despite evidence to the contrary. Why is this the case? The problem is, some blind spots are baked in by organizational pressures, which in turn, perpetuate seemingly indefinitely. These chronic blind spots are the toughest ones to eliminate. In almost every company, there are three key blind spots leaders unintentionally have that consistently hold their organizations back from achieving the audacious goals they set forth, undermine team trust, and erode the culture from the inside out. Here they are in no particular order: The Time Blind spot – How much time should your organization spend on innovation, change, or improvement efforts? Most leaders respond by focusing on specific parts of the process — committing the team to spend, say, 20 hours spread over six or seven weeks with clear high-level outcomes. But how do we know if 20 hours is sufficient or insufficient? We have to pick a number, and put a box around the activity, to avoid it becoming an endless endeavor. Yet, leaders often obsess about the time rather than the outcome. If it was really about time, why 20 hours? Why not 40? Or 400? Time should be measured not on its face, but relative to other organizational investments of time AND the outcomes you want to achieve. For example, consider how much leadership time, per week, is spent in meetings. The most common answer is 40–50% of one’s time, i.e., 16–20 hours per week. If you compare the outcomes of the 20 innovation hours over 6–7 weeks with 96–140 hours of meetings attended during that same time, which do you think delivers more value to the organization? This is the time blind spot: that 3 hours per week on innovation is somehow more wasteful than 16 hours per week in meetings. In addition, the outcome of the time invested in innovation likely will have a larger and more sustained impact on the organization’s success. The Positioning Blindspot – Consider a time whereas a leader, you cut corners to save upfront time and money, and found yourself buried in costly downstream problems. Was this a poor choice or just bad luck? While most leaders would never choose to take the harder path, that’s exactly what we do when we don’t consider choice positioning. One way to visualize this is through the lens of billiards. We become so focused on making the first shot that we fail to consider how we position the ball for the next shot. When we go to take the next shot, it’s harder than it had to be. We win the moment at the cost of the decade. In the process, the smallest shock causes massive damage. Yet this is the positioning blindspot. We don’t want to look like an idiot when times are good even if doing so offers an unstoppable advantage when times are tough. But good times eventually come to an end and being in a position to capitalize when times are bad requires doing different things when times are good. Leaders should try to always put their organization in the best position possible no matter the future conditions. Not only does this mean avoiding costly problems, but putting the organization in a position to perpetually play offense. The Priority Blindspot – Consider a leader who has a new idea they want to explore, and shifts the team’s efforts towards this new area. Or they identify a problem that they feel needs fixing immediately. Sometimes that’s good. Why don’t we launch two campuses at once? Why don’t we start a podcast and see if anything happens? Discontent with the status quo, after all, is the impetus to change. But not all discontent is holy – this is the priority blindspot. Sometimes discontent comes from having a bad day, being moody, or just deciding something on the spur of the moment. Leaders who behave this way almost always reverse their decision the next day or the next week. Or bump what was priority #1 down to priority #32 because it just isn’t as important anymore. That’s not only frustrating for people, but disrupts organizational efficiency, focus, and momentum. Just because you’re upset about something as a leader doesn’t mean it should become the top priority of the organization. Take the time to evaluate your blind spots, and better understand how they’re impacting your effectiveness as a leader, and the success of your organization. You might be unintentionally thwarting your own success. About the Author Andrea Belk Olson is a speaker, author, applied behavioral scientist, and customer-centricity expert. As the CEO of Pragmadik, she helps organizations of all sizes, from small businesses to Fortune 500, and has served as an outside consultant for EY and McKinsey. Andrea is the author of The Customer Mission: Why it’s time to cut the $*&% and get back to the business of understanding customers, No Disruptions: The future for mid-market manufacturing, and her upcoming book, What To Ask, coming in June 2022. She is a 4-time ADDY® award winner and host of the popular Customer Mission podcast. Her thoughts have been continually featured in news sources such as Chief Executive Magazine, Entrepreneur Magazine, The Financial Brand, SMPS Marketer, Rotman Magazine, and more. Andrea is a sought-after keynote speaker at conferences and corporate events throughout the world. She is a visiting lecturer and startup coach at the University of Iowa, a TEDx presenter, and TEDx speaker coach. She is also a mentor at the University of Iowa Venture School. More information is also available on www.pragmadik.com and www.andreabelkolson.com.
Nozomi Networks Labs Report: Ransomware Gangs and Supply Chain Vulnerabilities highlight risks as Law Enforcement fights back
While vulnerability disclosures increased 21% in the second half of 2021 and increasingly sophisticated criminal attacks made regular news, organizations are fighting back with targeted remediation efforts A new OT/IoT security trends report from Nozomi Networks Labs finds that while ransomware and Ransomware as a Service (RaaS) attacks continued to dominate cybercriminal activity in the second half of 2021, there was a slight uptick in state-sponsored actions as global tensions rise. Critical infrastructure such as healthcare, transportation, and food production is increasingly seen as highly vulnerable and lucrative targets based on their ability to disrupt society. More than 651 vulnerabilities were reported from July through December—a 21-percent increase over the previous six months. Supply chain vulnerabilities continue to offer the greatest opportunity to quickly spread damage across a wide range of products, service providers, or end-users. For the first time since Nozomi Networks began publishing the bi-annual report, there are early signs that defenders are maturing their strategies for security and resilience and maybe starting to gain an upper hand. In the second half of the year, international law enforcement agencies combined efforts to take down ransomware gangs, seize bitcoin bounties and make criminal arrests. And, in spite of predictions that the Apache Log4j vulnerability would be the most widely exploited security breach ever, the attacks have not seen the catastrophic loss that was predicted. “Security organizations and law enforcement are punching back,” said Nozomi Networks Co-founder and CTO Moreno Carullo. “We are seeing some good signs that more security professionals are modernizing their defenses to address both prevention and resiliency and that a post-breach mindset is paying off. Threats may be on the rise, but technologies and practices to defeat them are available now as we have greater insights into the nature of the vulnerabilities and attacks. We encourage more organizations to strengthen their security and situational awareness so they too are prepared in the face of an attack.” Nozomi Networks’ “OT/IoT Security Report” provides security professionals with the latest insights needed to re-evaluate risk models and security initiatives, along with actionable recommendations for securing critical infrastructure. This latest report includes: An overview of the threat landscape, such as: Notable ransomware updates An assessment of supply chain attacks in the second half of 2021 and The state of Access Brokers Markets The latest statics on ICS-CERT vulnerabilities – with a deeper dive into exploitation trends Remediation strategies to help ensure organizations stay ahead of emerging threats Related Resources: Read: OT/IoT Security Report Read the Blog Post: New Report: Trends and Countermeasures for Critical Infrastructure Attacks Sign Up for the Webinar: OT/IoT Security Review 2021 2H: Lessons for Critical Infrastructure
MyGovWatch.com expands AI-Powered Government leads platform to serve 200+ Industry Subcategories
No-Contract, No-Hassle, Industry-Targeted Leads from Every Level & Type of Government Buyer MyGovWatch.com, a government bid notification, and intelligence website have expanded its platform to more than 200 industry subcategories. At the same time, the company has announced users will now benefit from the deployment of a proprietary artificial intelligence (AI) engine to help route the exact right leads to companies large and small interested in government contracting opportunities. The site now features 24 top-level industry categories to include: Finance & Risk Marketing & Creative Services Supplies & Equipment Professional Services Arts & Culture Education & Training Food & Hospitality Government Support Health & Wellness Parks & Recreation Safety & Security Uniforms, Clothing & Laundry Construction & Trades Facilities, Property & Maintenance Agriculture & Natural Resources Waste & Disaster Management Fuel & Energy Aerospace & Defense Hardware & Industrial Infrastructure Transportation Information Technology Software Telecommunications Each top-level category contains up to 24 industry subcategories so that users can now set extremely granular preferences around their business interests in the B2G space in a way never before possible. Further, the AI engine learns as it goes, so that users benefit from continuous training on which procurement titles it routes to each of more than 200 industries. “These enhancements firmly position MyGovWatch to compete in the marketplace with anyone,” said Nick Bernardo, President, continuing, “I would like to thank our team for their amazing dedication to bring these enhancements to our users, and I am excited about future deployments we have in mind that will change the landscape of this space.” MyGovWatch has revolutionized how current and aspiring government contractors hear about and interact with leads by giving users the ability to get in where they fit it, through low-cost, no-contract monthly plans and transaction pricing on completing open records requests, for example. Whether you are a sole proprietor or large corporation, or anywhere in between, there is no better time to get started and compare us to your current provider. To get started with a 14-day trial, visit www.mygovwatch.com.
Global Forklifts Market Trajectory & Analytics Report 2021: Born Out of Necessity, Forklifts Surge Ahead on the e-Commerce Boom – ResearchAndMarkets.com
The “Forklifts – Global Market Trajectory & Analytics” report has been added to ResearchAndMarkets.com’s offering. Global Forklifts Market to Reach US$50.5 Billion by the Year 2026 Amid the COVID-19 crisis, the global market for Forklifts estimated at US$37.9 Billion in the year 2020, is projected to reach a revised size of US$50.5 Billion by 2026, growing at a CAGR of 5% over the analysis period. An increase in productivity, decrease in downtime, operator comfort, and reduced number of accidents and injuries are the other key factors fueling growth in the forklifts market. Booming e-commerce and retail businesses, flourishing automotive component manufacturing, growing consumable goods industry and rising construction industry are further augmenting demand for forklifts. Advancements in technology are paving way for the greater adoption of forklifts. The advent of intelligence forklifts, robotic lift trucks, forklifts with ultra-capacitors, fast charging battery-based forklifts, fuel cell-powered forklift trucks, and cost-effective and eco-friendly hydrogen power trucks are drastically influencing the growth opportunities in the forklifts market. The forklift truck market is receiving a major growth impetus from the increasing acceptance of electric vehicles as a result of ongoing technological advancements coupled with the rising cost of traditional fuels. Internal Combustion Engine (ICE), one of the segments analyzed in the report, is projected to grow at a 4.6% CAGR to reach US$35.5 Billion by the end of the analysis period. After a thorough analysis of the business implications of the pandemic and its induced economic crisis, growth in the Electric segment is readjusted to a revised 5.6% CAGR for the next 7-year period. Internal Combustion Engine (ICE) forklifts dominate the market as heavy-duty forklifts that find use in outdoor activity are typically driven by diesel. However, owing to the stringent regulatory emission norms for regulating CO2 emissions and relatively high maintenance costs, diesel forklifts are making way for electric forklifts that are powered by electricity. The rise in adoption of electric forklifts due to its benefits over internal combustion (IC) engines powered forklifts and increase in investments targeted at advancements in battery technology are poised to fuel the growth of electric forklifts in the near future. Retail & Wholesale (End-Use) Segment to Reach $18.5 Billion by 2026 Rapidly rising e-commerce and retail business, and reducing trade barriers between various regions across the world are significantly increasing the number of warehouses, which require forklifts to properly arrange the products. The surging demand from warehouses is propelling growth in the forklifts market. In the global Retail & Wholesale (End-Use) segment, USA, Canada, Japan, China, and Europe will drive the 3.82% CAGR estimated for this segment. These regional markets accounting for a combined market size of US$11.1 Billion in the year 2020 will reach a projected size of US$14.7 Billion by the close of the analysis period. China will remain among the fastest-growing in this cluster of regional markets. Led by countries such as Australia, India, and South Korea, the market in Asia-Pacific is forecast to reach US$2.4 Billion by the year 2026, while Latin America will expand at a 4.7% CAGR through the analysis period. The U.S. Market is Estimated at $10.8 Billion in 2021, While China is Forecast to Reach $8.9 Billion by 2026 The Forklifts market in the U.S. is estimated at US$10.8 Billion in the year 2021. The country currently accounts for a 27.5% share in the global market. China, the world’s second-largest economy, is forecast to reach an estimated market size of US$8.9 Billion in the year 2026 trailing a CAGR of 6.2% through the analysis period. Among the other noteworthy geographic markets are Japan and Canada, each forecast to grow at 3.6% and 4% respectively over the analysis period. Within Europe, Germany is forecast to grow at approximately 4.9% CAGR over the analysis period. The US and Europe represent the largest regional markets for forklifts. The encouraging scenario on the wholesale & retail distribution front coupled with anticipated robust demand for replacement of forklift trucks is expected to spiral demand for forklifts. Adoption of advanced technologies and the Industry 4.0 initiative by the governments will create growth opportunities for the forklifts market. Further, a thriving e-commerce market and surging demand for battery-operated forklift vehicles are expected to spur growth in the European market. Key Topics Covered: I. METHODOLOGY II. EXECUTIVE SUMMARY 1. MARKET OVERVIEW Proliferation of E-Commerce Solutions amidst COVID-19 Knock-On Effect of the Pandemic on Forklift Market Global Forklifts Market Struggles with Supply Side Shocks Flip Side of Material Handling Industry Explosion & Steep Demand for Forklifts Material Handling Equipment (MHE): An Introduction Forklift: Integral Part of MHE Types of Forklifts Counterbalanced Forklift Warehousing Forklifts Forklift by Fuel Types Internal Combustion Engine (ICE) Electric Forklift by Tonnage Capacity Classification by Forklift Classes Key Strategies to Ensure Safe Use of Forklifts in Work Environments Born Out of Necessity, Forklifts Surge Ahead on the e-Commerce Boom Prominent Factors to Turbocharge Global Forklifts Market Forklift Arena Keeps Buzzing with Latest Technological Trends Developed Markets: Traditional Revenue Contributors Developing Countries Turbo Charge Future Market Growth Internal Combustion Engine Forklifts Making Way for Electric Forklifts Retail & Wholesale End-Use Segment to Maintain its Dominance Competitive Scenario Recent Market Activity Select Innovations Global Competitor Market Shares 2. FOCUS ON SELECT PLAYERS (Total 81 Featured) Anhui Heli Co., Ltd. CLARK Material Handling Company (CMHC) Combilift Ltd. Crown Equipment Corporation Godrej Material Handling HANGCHA GROUP CO., LTD Hyster-Yale Materials Handling, Inc. Jungheinrich AG KION Group AG Komatsu Ltd. Lonking Holdings Limited Mitsubishi Logisnext Co., Ltd. Toyota Industries Corporation 3. MARKET TRENDS & DRIVERS Increasing Popularity of Fuel Cell-powered Forklifts to Drive Global Forklift Market Myriad Benefits to Broaden Battery-operated Forklifts Application Automated Forklifts Rise in Prominence Electric Forklifts Gain Traction Emphasis on Green Warehousing Steers Demand for Electric Forklifts Electric Forklifts Experience Impressive Makeover with Sophisticated Technology COVID-19 Glitches Hustle Forklift Users to Embrace Electric Versions Forklift Tires Market: Characterized by Growing Demand for Solid and Non-Marking Tires Lift Truck Become a Part of the Connected Enterprise Ecosystem Forklifts Emerge as an Important Material Handling System for the Logistics and Shipping
Port of Long Beach creating nation’s largest Electric Truck Charging Network
Input from potential vendors, suppliers sought for clean air system The Port of Long Beach has issued an information request to assist in creating one of the largest U.S. networks of publicly accessible electric-charging stations for the heavy-duty, Class 8 drayage trucks that serve the port complex. Available here, the request asks for information on potential interest to install 100 chargers at up to four pre-identified sites. Responses are due by 4:30 p.m. Tuesday, March 29. Transitioning the drayage truck fleet serving the San Pedro Bay ports to zero emissions by 2035 is a central tenet of the Clean Air Action Plan Update, or CAAP, the shipping industry’s most aggressive effort to reduce the environmental impacts of goods movement. “It’s important for us to nurture the market for electric trucks if we are to meet the zero-emissions trucks goal,” said Port of Long Beach Executive Director Mario Cordero. “This is one of the project’s objectives, and it will also provide an overnight charging option for independent owner-operators who may not be able to charge their vehicles at home.” “Our environmental programs and initiatives have already cut diesel emissions from trucks by as much as 97%,” said Long Beach Harbor Commission President Steven Neal. “Initiatives like this are steps along the way to our ambitious zero-emissions goal. It will take ingenuity and continuing strong partnerships with the trucking and goods movement industry, but I am confident we will succeed.” The first two public charging stations for heavy-duty trucks in Southern California have been installed at the Terminal Access Center on Harbor Avenue and are expected to be available for drayage truck recharging later this month. Providing at least 100 charging stations by 2028 supports the CAAP zero-emissions goal for drayage trucks. The CAAP is a comprehensive strategy for accelerating progress toward a zero-emission future while protecting and strengthening the port’s competitive position in the global economy. Since 2005, the year before the plan was adopted, diesel particulate matter is down 90%, smog-forming nitrogen oxides have decreased 62%, and sulfur oxides have decreased 97%, all while container throughput has increased 21%.
NAW announces Inaugural Distributors Deliver Award winners
The National Association of Wholesaler-Distributors (NAW) just announced the winners of its inaugural Distributors Deliver Award given at last week’s NAW 2022 Executive Summit in Washington, DC. The NAW 2022 Executive Summit was the organization’s most-attended Summit on record and marked the event’s return in person after its Virtual Summit in 2021. “We’re proud to recognize the wholesaler-distributors who stepped up last year and helped NAW provide more than $1 million in PPE and other supplies to help run vaccine clinics, reopen cities, and protect Americans through our partnerships with NFL teams and the National League of Cities,” NAW CEO Eric Hoplin said. “The wholesale distribution industry’s hundreds of thousands of companies and millions of employees are well-known for their commitment to philanthropy and community and we look forward to continuing to recognize them each year.” Last year, NAW partnered with NFL stadium vaccination sites to provide over $500,000 worth of PPE in their efforts to vaccinate more than two million people. NAW and the National League of Cities partnered to reopen communities and surpassed $1,000,000 in donations of critical personal protective equipment and other supplies. The NAW Distributors Deliver Award, which will be presented annually at NAW’s Executive Summit, recognizes the philanthropic efforts of wholesaler-distributors and their commitment to charity, community, and improving lives. The 2021 NAW Distributors Deliver Award recipients are as follows: ABM Industries Accelerate360 Benco Dental Building Material Distributors (BMD) Bunzl North America Cameron Ashley Building Products Clock Medical Supply COE Distributing Competitive Choice Concordance Healthcare Solutions Cope Plastics EBP Supply Solutions Global Industrial Grainger HD Supply Henry Schein Hillyard Imperial Beverage Johnstone Supply Kimball Midwest Millcraft MSC Industrial Supply Co. Nelson-Jameson Patterson Companies, Inc. Piedmont Plastics Polymershapes SanMar ScanSource Seitz Inc. Uline
EP 250: MODEX 2022 Excitement!
In this episode, I share my excitement for the upcoming MODEX 2022! Just about two months away we will be at MODEX the week of March 28th and The New Warehouse will have a booth on the floor. You can check us out at booth C4277 where we will be doing interviews right from the floor. Feel free to stop by and jump on the microphone if you like. Here are a few of the things I am looking forward to the most. Five Things I am Excited For Of course the first thing is being in person! I am very excited to get on the floor and see some connections, make some new ones and of course, see all of the great solutions on display. It has been 2 years now since the last in-person MHI event and I believe it will be a huge hit as people will be itching to get back to it. There will be so many interesting exhibits with technology accelerating so much over the last two years. The second thing I am excited about is to see where robots currently stand. There has been a ton of robot adoption by companies during the pandemic so I am curious to see how that has pushed the space forward and also hear from solution providers just how much companies are embracing the technology. Additionally, one of the big takeaways from MODEX 2020 was the large number of collaborations that were taking place. I am interested to see how this has expanded and what new collaborations are also occurring to help move the industry forward. Exoskeletons are also something I am really interested in seeing. I got a little taste of a few at my recent trip to the DHL Innovation Center and I have seen some other companies popping up so I am curious to see some of the different solutions. Also hoping I can try a few on and share my thoughts with you. I think these are really a key to helping workers be safer and also expanding the labor pool a bit as they can assist in lifting heavier items or give the items less weight to those who are lifting. For 2022 in general micro-fulfillment is on my radar and I think there is a big market that is ready to be expanded upon. It will be very interesting to see how companies are going to be addressing this segment and to what extent. I think that technology solutions specifically designed for this space will be a key to seeing success here so I am curious what technologies might be designed for micro-fulfillment. The last thing is the keynote by Shaq of course! I can imagine this will be a very entertaining talk and I am interested to hear what he has to speak about as someone that has been able to diversify himself so much. I think this will be a lot of fun! Listen to the episode below and comment on what you are looking forward to at MODEX this year. The New Warehouse Podcast EP 250: MODEX 2022 Excitement!
Long-Distance Leadership: Managing a remote or Hybrid Workforce the right way
Managing people who work from home is nothing new for many leaders, but getting the mechanics right can be another matter. With a few smart moves, anyone can learn to manage a remote workforce effectively. Move One: Recognize that you may have been thrown into the deep end of the pool without much preparation A lot of leaders who are managing remote or hybrid teams didn’t get much warning about their new normal. People were in the office one day and gone the next. Although everybody did the best they could at the time, fast answers and actions don’t always equal good management. If your remote or hybrid team is running like a well-oiled machine, take a hard look at why, and don’t use location as an excuse. Move Two: Stop trying to make remote work function as in-person work does In much the same way that apples are apples and oranges are oranges, remote work is different from an in-person experience. Accept and embrace the differences. Yes, people working remotely may move laundry from the washer to the dryer in between meetings. Yes, they may answer the doorbell during work hours. No, you’re not going to run into them in the cafeteria. And just because they will answer the email at 9:00 pm doesn’t mean that you should accept that behavior as a given. Remote is remote, and onsite is onsite. Think about how you should adjust your style and behaviors to enable people to give you their best in each environment. Move Three: Plan better Managers without a plan and routines often survive in an onsite environment. Their charm, personalities, and quick thinking save the day. When work goes remote, however, many of those people stumble. Leading at a distance requires deliberate calendaring and regular check-in meetings. Some people check in at the beginning or end of each day, others meet every other day, and some schedule virtual lunches. Regardless of the specifics, what’s consistent is a contact pattern. To keep your remote group in the loop, build routines and stick with them. In uncertain times, this is one area where you can nail it simply by having a plan and executing it. Move Four: Be specific about expectations Strong managers know that clear expectation are an essential element in the equation for getting what they want, and remote work amplifies the requirement. In other words, if you are not clear, don’t be surprised when you are disappointed. Ask yourself a lot of questions. Do you expect people to be available at certain hours? Do you expect them to shut work off at a certain time? Have you told your team what you want in terms of quantity and quality of work? What about milestones and status updates? Move Five: Resist the urge to micromanage “Even though she says she works best late at night and our work doesn’t slow down if she keeps odd hours, I don’t care. I want her focused from 8:00 am to 5:00 pm, just as if she were in the office.” While there are plenty of reasons to zero in on how work is done, ask yourself if you’re too deep in the weeds. For instance, if your direct report has a kid’s soccer game at 3:00 in the afternoon but he started working at 6:00 in the morning, does that schedule shift affect the work in any material way? If not, and you can’t flex, you’re not doing yourself any favors. Most people dislike working for control freaks and will get away from them when the opportunity presents itself. Move Six: Spend more time connecting the dots and explaining why “Rebecca, you are in a customer-facing role. Because our clients may need to reach you during our core hours, it’s important that you are available to them between 9:00 and 5:00 each day.” A why explanation communicates not only the expectation but the reason behind it. When a reason is missing, people draw their own conclusions about why, and sometimes they get it wrong. “Rebecca, we need you to be available between 9:00 and 5:00.” In the second example, Rebecca may conclude that her core hours requirement is due to micromanaging instead of a genuine business need – a false conclusion, but nevertheless the one at which she arrived. Move Seven: Help the team make connections with each other Good remote managers have strong relationships with their direct reports. Great remote managers do the same, and they help their people connect with each other. In practical terms, this means scheduling watercooler time and deliberate team building. Move Eight: Ask for feedback Thanks to technological advances and shifting norms, the remote workplace is constantly evolving. What worked two years ago may not work today, and what’s working now probably won’t be the perfect fit in the future. Periodically take stock and ask your team for feedback. Do you get enough guidance? Do you get too much? Do you feel connected with your coworkers? What can we do to improve? What should we stop doing? If you ask good questions, you’ll learn a lot. Leading at a distance is a skill anyone can develop. What’s your next move? About the Author: Kate Zabriskie is the president of Business Training Works, Inc., a Maryland-based talent development firm. She and her team provide onsite, virtual, and online soft-skills training courses and workshops to clients in the United States and internationally. For more information, visit www.businesstrainingworks.com.
PLASTICS promotes Patrick Krieger to Vice President for Sustainability
The Plastics Industry Association (PLASTICS) has promoted Patrick Krieger, Senior Director for Materials & Sustainability, to the newly created role of Vice President for Sustainability. “As an industry, we intend to be all-in on sustainability, helping to lead the way toward a truly circular economy. Patrick will play an essential role on that journey,” said Tony Radoszewski, President and CEO of PLASTICS. “Patrick’s stellar performance as Senior Director for Materials and Sustainability, which included important work with our Recycling and other Material Supplier committees, made him the obvious choice to lead our sustainability efforts.” Krieger’s accomplishments to date include significant roles in guiding New End Market Opportunities (NEMO) projects for PLASTICS, as well as contributing to the growth of Operation Clean Sweep, a program in which companies dedicate themselves to measures aimed at preventing the release of resin into the marine environment. He is also responsible for the creation of Bioplastics Week, a successful online event geared toward educating both industry and consumer audiences about biobased plastic materials. Bioplastics Week gave rise to Plastics Recycling Week in 2021, another popular event that PLASTICS intends to grow this year. “I’m looking forward to the opportunity of working with our members to promote and improve the sustainability of the plastics industry,” said Krieger. “Improving recycling and recycling infrastructure, renewable feedstocks, or addressing the problem of marine debris – we are just getting started.” Krieger also organizes PLASTICS’ Re|Focus Recycling and Sustainability Summit, a multi-day conference during which industry professionals hear from expert speakers and their peers on solutions that will improve their sustainability efforts. A key feature of the Summit is the annual Sustainability Innovation Award competition, in which companies from both inside and outside the organization can showcase their efforts to contribute in the areas of recycling and sustainability. Beginning his career at PLASTICS in 2015 as Assistant Director of Regulatory and Technical Affairs, Krieger became Director of Regulatory and Technical Affairs in 2018, and then Senior Director for Materials and Sustainability in 2020. Before joining PLASTICS, Krieger served as Regulatory Affairs Manager for the Animal Health Institute. He is a 2007 graduate of Texas A&M University with a Bachelor of Science degree in Agricultural Leadership and Development.