ALAN Tropical Storm Francine Situation Report: September 13, 2024

ALANaid logo

ALAN has been improving logistics response to disasters for 19 years, and the need is greater now than ever. Please donate today to help us continue our work for many more years to come. American Logistics Aid Network is mobilized for Hurricane/Tropical Storm Francine. As part of our response efforts, we are committed to providing you with the latest information and updates on supply chain impacts via our periodic Situation Reports, which can be found below in this email and on our website. In the wake of Tropical Storm/Hurricane Francine’s landfall along the Gulf coast, the American Logistics Aid Network (ALAN) is urging area residents to heed safety advisories – and reminding members of the logistics community that their post-storm help could be needed soon. In addition to working closely with the non-profit and emergency response communities, ALAN is providing real-time visibility on the storm’s supply chain impacts—including damages to roads, ports, and airports—via its Supply Chain Intelligence Center, which individuals and businesses can access free of charge. ALAN has also updated its Disaster Micro-Site with helpful Tropical Storm/Hurricane Francine resources. That site is where ALAN will post requests for donated logistics assistance, most of which will arrive within 24 to 72 hours after the storm’s initial landfall. Logistics businesses that wish to make a financial donation to ALAN instead can do so by visiting https://www.alanaid.org/donate/ EMERGENCY DECLARATIONS President Biden approved an Emergency Declaration for Louisiana on September 10, 2024, in preparation for impacts from Tropical Storm Francine beginning on September 10, 2024 and continuing. STATE DECLARATIONS Mississippi Governor Reeves issued a State of Emergency Proclamation for Tropical Storm Francine on September 10, 2024. Louisiana Governor Landry issued Executive Order Number JML 24-142 State of Emergency for Tropical Storm Francine on September 9, 2024. Louisiana Department of Transportation Secretary Donahue issued a Secretary’s Emergency Order on September 9, 2024, in preparation for the impacts of Tropical Storm Francine. ACTIVE TRANSPORTATION WAIVERS Title: Mississippi Governor Reeves issued Executive Order No 1582 for Tropical Storm Francine. Effective: 09/10/24| Expires on: 09/24/24 Description: The Governor issued a Proclamation declaring a State of Emergency for Tropical Storm/Hurricane Francine on September 9, 2024. Executive Order waives specific provisions of Parts 390 through 399 of Title 49, CFR, including relief from Title 49, Part 395.3 and 395.5 for motor carriers providing direct assistance to disaster relief efforts. Title: Louisiana Department of Public Safety Deputy Secretary declared a regional emergency Effective: 09/10/24| Expires on: 09/23/24 Description: The Department of Public Safety Deputy Secretary declared a regional emergency providing exemption pursuant to Title 49, CFR, Part 390.23 and LA R.S. 32:1501 ET SEC, 1 and certain exemptions from Parts 390 through 399 of Title 49, FMCSR. Title: Louisiana Department of Transportation Secretary Donahue issued Secretary’s Emergency Order Effective: 09/09/24| Expires on until rescinded Description: The Department of Transportation Secretary issued a Secretary’s Order with respect to commercial motor carriers traveling for the purpose of emergency preparedness and disaster relief efforts; provisions of Louisiana Revised Statue 32:386(1) are suspended, and the size and weight restrictions for vehicles. STATE BUSINESS AND INDUSTRY RESOURCES State of Louisiana Virtual Louisiana Hurricane Francine Resources Department of Transportation LaGeaux Oversize / Overweight Truck Permitting Louisiana Business Emergency Operations Center Tropical Storm Francine Operation Emergency Louisiana Get a Game Plan Business Resources Louisiana DOTD Evacuation Map Application State of Mississippi Mississippi Business Emergency Operations Center State of Texas Texas Economic Development & Tourism Business Resources Texas Workforce Commission Resources for Employers ROAD CONDITIONS Louisiana 511 Mississippi MDOT Traffic Drive Texas CURFEWS (as of September 13, 2024) Amite (6 pm to 6 am until further notice) Berwick (lifted) Iberia Parish (lifted) Independence (lifted) Jeanerette (lifted) Lafourche Parish (lifted Friday morning) Morgan City (lifted) St. Helena Parish (Wednesday until further notice) St. Mary Parish east of Calumet Cut (Thursday until further notice) Tangipahoa village (lifted) Terrebonne Parish (8 am Wednesday until further notice) Washington Parish (lifted) EVACUATION STATUS (as of September 13, 2024) State of Louisiana Assumption Parrish (voluntary) Cameron Parish (mandatory) Iberia Parish (voluntary) Jefferson Parish (mandatory outside flood protection levee) Lafayette Parish (voluntary) Lafourche Parish (mandatory) Plaquemines (lifted as of 9/12 12:30 pm) Port Fourchon (mandatory) St. Martin Parish (voluntary) St. Mary Parish (voluntary) Terrebonne Parish (mandatory, zone 1) State of Mississippi Bay St. Louis (mandatory, all boats) Diamondhead (voluntary) Waveland (voluntary) State of Texas Galveston County (voluntary) PORT CONDITIONS (as of September 13, 2024), per USCG Home Port) State of Louisiana Amelia (closed) Atchafalaya River (open) Bayou Boeuf Lock (closed) Bayou Chene (closed) Bayou Lafourche (closed) Bayou Sorrel Lock (open) Berwick (closed) Cameron (open) Charenton Canal (closed) Houma Navigation Canal (closed) Intercoastal City (closed) Lake Charles (open) Leland Bowman Locks (open) Mississippi River (open) Morgan City (closed) Orange (open with restrictions) Old River Lock (open) Port Allen (open) Port of Greater Baton Rouge (open) Port Fourchon (open) Port of New Iberia (closed) Port of New Orleans (open) Port of Plaquemines (open) Port of South Louisiana (open) Port of St. Bernard (open) Port of West St. Mary (closed) Sabine (open) State of Texas Beaumont (open) Calhoun Port Authority (open) Freeport (open) Galveston (open with restrictions) Harlingen (open) Houston (open) Port Arthur (open) Port of Brownsville (open) Port of Corpus Christi (open) Port of Isabel (open) Port of Mansfield (open) Port of Palacious (open) Port of Victoria (open) Texas City (open) AIRPORT CONDITIONS (as of September 13, 2024) Baton Rouge Metropolitan Airport (open with delays) Jackson International Airport (open, general delays) Louis Armstrong New Orleans International Airport (open, general delays) UTILITIES (as of September 13, 2024) State of Alabama As of 12 pm CDT there are 3,322 reported power outages in Alabama Alabama Power Outage Map State of Louisiana 12pm CDT, there are 114,493 reported power outages in Louisiana Louisiana Entergy Power Outage Map New Orleans Entergy Power Outage Map CLECO Power Outage Map Washington-St. Tammany Electric’s Outage Map Louisiana Public Service Commission Utility Outage Resources Louisiana Power Outages State of Mississippi As of 12 pm CDT there are 724 reported power outages in Mississippi Entergy Power Outage Map Mississippi Public Service Commission Storm Information State of Mississippi Power Outages State of Texas Public Utility Commission of Texas Outage Viewer STATE / CITY EMERGENCY MANAGEMENT AGENCY Louisiana Governor’s Office of

GEODIS to Hire 3,700 Seasonal Workers for Peak Season

GEODIS Teammate During Peak Season_Photo Credit Eli Hiller

GEODIS has announced plans to hire 3,700 seasonal workers across its campuses in the U.S. and Canada to help manage the expected rise in volumes during peak season. This hiring initiative will bolster the company’s operational capacities in its warehouses and distribution centers in preparation for the holiday season, a time when consumer demand surges. Emarketer noted U.S. holiday sales in 2023 increased 3.9% year-over-year as consumer spending grew even amidst uncertain economic times, and a similar pattern is projected for this year. Emarketer expects a substantial 4.8% increase in holiday retail sales for 2024, signifying continued growth despite factors such as inflation and consumer price sensitivity. In anticipation of this demand, GEODIS is seeking seasonal employees to join its nearly 17,000 teammates who power its operations across North America. GEODIS is recruiting material handlers and equipment operators across 13 regions in the U.S. and Canada this peak season. The company offers competitive wages, peak premium pay incentives, peak and referral bonuses, and an expedited payment option that allows workers to receive up to 50% of their paycheck before payday through an on-demand program. Additionally, GEODIS provides flexible schedules with weekend opportunities and multiple shift options daily, allowing teammates to choose times that best suit their lives. Both part-time (under 30 hours a week) and full-time (over 30 hours a week) seasonal positions are available. Prospective teammates can also use GEODIS’ virtual recruiting assistant, Sophie, to find the right role, easily navigate the application process and receive fast answers to questions before being connected to a recruiter for next steps. “We acknowledge the immense responsibility we have to our customers to deliver exceptional service every day, and this is especially true during peak season,” said Anthony Jordan, GEODIS in Americas Executive Vice President and Chief Operating Officer. “Because peak season is the most business-critical sales period of the year for many of our retail clients, expanding our workforce is vital to ensure we have a flexible, dynamic team that can handle anticipated surges in demand.” GEODIS’ culture puts teammates at the forefront by offering opportunities for employees to provide feedback and suggestions through surveys, personal check-ins and group meetings. The company also prioritizes teammate safety and ensures optimal work conditions in modern facilities with state-of-the-art technology. GEODIS invests in its teammates with paid safety-focused training, allowing them to gain hands-on experience so they can feel confident from day one of employment. “GEODIS is committed to creating a diverse and supportive work environment where employee well-being is our top priority,” said Jordan. “Whether looking for extra income during the holidays or wanting to explore a long-term path at GEODIS, our teammates have the opportunity to make a difference and receive the training and support they need to move their careers forward.”

Manufacturing Technology orders look to rebound as IMTS 2024 opens, rate cuts loom

USMTO powered by AMT logo

Orders of manufacturing technology, measured by the U.S. Manufacturing Technology Orders report published by AMT, totaled $321.7 million in July 2024, showing declines of 19.3% from June 2024 and 7.8% compared to July 2023. Orders of manufacturing technology, measured by the U.S. Manufacturing Technology Orders (USMTO) report published by AMT – The Association For Manufacturing Technology, totaled $321.7 million in July 2024. Orders declined 19.3% from June 2024 and declined 7.8% compared to July 2023. Year-to-date orders reached $2.53 billion, a decline of 10.5% from the first seven months of 2023. July is typically one of the slower months of the year for manufacturing technology orders. Despite that, July 2024 is 3.8% above the pre-2020 average for the month. Cancellations were the highest since July 2023, and the ratio of cancellations to new orders remained above the historical average in all but two months of this year. Despite these mixed messages, there are signs that the industry may be at the beginning of the anticipated rebound. While the value of orders declined from June to July 2024, the number of units ordered in July 2024 increased by 1.9% over June 2024. Contract machine shops, the largest customer of manufacturing technology, outperformed the market for the first time in several months. The value of manufacturing technology orders contracted less than 5%, while the number of units ordered increased nearly 10% from June to July. This indicates that shops are beginning to expand capacity in anticipation of their customers placing additional orders for parts. Conversely, medical equipment manufacturers increased the value of their orders from June to July 2024 while decreasing the number of units. With a manufacturing process that requires high precision, traceability, and customization, the medical industry typically places orders for more sophisticated machinery. Some estimates predict this industry will grow by 50% between now and 2029, so this sector is poised to become a reliable customer of manufacturing technology. Orders from manufacturers of electrical generation and distribution equipment were flat from June to July 2024. However, because July was a down month, they comprised a larger share of the total orders. This sector has pulled back orders from their peak in early 2023 but remain on an upward trend. Increased power demand from data centers as well as a larger focus on grid modernization has made this a very important sector for manufacturing technology. After Federal Reserve Chair Jerome Powell’s speech at the Jackson Hole Economic Symposium and the weak August jobs report, a rate cut at the Fed’s September meeting is all but certain, according to market reactions. Assuming the Fed has managed to guide the economy to a soft landing, predicting how machine tool orders will react is difficult due to the lack of historical examples of soft landings – especially compared to the many examples of recessions. Still, with the anticipated rate cut expected to begin alleviating some concerns of households and businesses, renewed demand up and down the supply chain may be on the doorstep as manufacturers converge on #  #  # The United States Manufacturing Technology Orders (USMTO) Report is based on the totals of actual data reported by companies participating in the USMTO program. This report, compiled by AMT – The Association For Manufacturing Technology, provides regional and national U.S. orders data of domestic and imported machine tools and related equipment. Analysis of manufacturing technology orders provides a reliable leading economic indicator as manufacturing industries invest in capital metalworking equipment to increase capacity and improve productivity. USMTO.com. AMT – The Association For Manufacturing Technology represents U.S.-based providers of manufacturing technology – the advanced machinery, devices, and digital equipment that U.S. manufacturing relies on to be productive, innovative, and competitive. Located in McLean, Virginia, near the nation’s capital, AMT acts as the industry’s voice to speed the pace of innovation, increase global competitiveness, and develop manufacturing’s advanced workforce of tomorrow. With extensive expertise in industry data and intelligence, as well as a full complement of international business operations, AMT offers its members an unparalleled level of support. AMT also produces IMTS – The International Manufacturing Technology Show, the premier manufacturing technology event in North America. AMTonline.org. IMTS – The International Manufacturing Technology Show is where the creators, builders, sellers, and drivers of manufacturing technology come to connect and be inspired. Attendees discover advanced manufacturing solutions that include innovations in CNC machining, automation, robotics, additive, software, inspection, and transformative digital technologies that drive our future forward. Powered by AMT – The Association For Manufacturing Technology, IMTS is the largest manufacturing technology show and marketplace in the Western Hemisphere. With more than 1.2 million square feet of exhibit space, the show attracts visitors from more than 110 countries. IMTS 2022 had 86,307 registrants, featured 1,816 exhibiting companies, saw over 7,600 people attend educational events, and included a Student Summit that introduced the next generation to manufacturing. Be the change at IMTS 2024, Sept. 9-14, 2024. Inspiring the Extraordinary. IMTS.com. AuthorChristopher Chidzik

Every Step Matters … and So Does Every Sponsor

Ladder Safety Month

Ladder Safety Month: American Ladder Institute offers sponsorships for 2025 campaign This past March, the message of National Ladder Safety Month reached millions of people. Now, the American Ladder Institute (ALI) is seeking sponsors for the 2025 campaign, so it can reach even more. The sponsorship is a valuable brand extension for any company invested in the manufacture of ladders OR in their safe use. Companies with employees working at heights understand the value of emphasizing safety and its impact on accident prevention and saving lives. Observed every March, National Ladder Safety Month is the only program dedicated exclusively to promoting ladder safety at home and work. Each year, tens of thousands are injured and hundreds die in accidents caused by improper ladder usage. The reach of National Ladder Safety Month only expands with the support of its sponsors. They are the driving force behind helping to raise awareness on safe use and decreasing these tragic numbers. ALI, the only approved developer of safety standards for the U.S. ladder industry, is the present sponsor for National Ladder Safety Month. Other major sponsorship opportunities are also available and can be found by reading the 2025 prospectus. Sponsorship packages are available at a variety of participation levels, each with a slate of promotional benefits for sponsors, including logo appearance on materials, tagged recognition in social media posts, social media mentions, listings in press releases, dedicated email blasts to ALI’s database of more than 23,500, web banner ads, and more. The 2024 campaign delivered to sponsors more than 900,000 social media impressions, more than 264 million press release impressions, and an email open-rate of 38%, which is 13% higher than the industry average. The Top Cap sponsor (limited to one) earns the most benefits, for a participation level of $25,000. There are also opportunities for Middle Rung Sponsors, First Rung Sponsors, Supporting Partners, Associates, and more, with participation levels starting at just $500. The theme of National Ladder Safety Month 2025 is “Every Step Matters.” It serves as a reminder of the necessity to be present and mindful at all times on a ladder, as well as the importance of making ladder safety part of regular safety training. The goals of the campaign are to raise awareness of ladder safety, decrease injuries and fatalities caused by ladder misuse, and increase the number of people certified in Ladder Safety Training.

American Logistics Aid Network calls on industry businesses to help with Tropical Storm/Hurricane Francine relief

ALANaid logo

As Tropical Storm/Hurricane Francine intensifies and approaches the Gulf coast, the American Logistics Aid Network (ALAN) is urging area residents to heed safety advisories – and reminding members of the logistics community that their post-storm help could be needed soon. “All signs point to Tropical Storm/Hurricane Francine making landfall as a Category 2 hurricane, and because the area has experienced so much rain in the past two weeks, officials are expecting lots of downed trees, significant power outages, and water systems disruptions that could last several days. Inland flooding is likely across Louisiana and parts of Mississippi and Texas,” said Kathy Fulton, ALAN’s Executive Director. “As a result, we have already begun receiving requests for assistance – and we are mobilizing accordingly.” In addition to working closely with the non-profit and emergency response community, ALAN is monitoring the storm’s real-time path and supply chain impacts—including damages to roads, ports, and airports—via its Supply Chain Intelligence Center, which individuals and businesses can access free of charge. ALAN has also updated its Disaster Micro-Site with helpful Tropical Storm/Hurricane Francine resources. That site is where ALAN will post requests for donated logistics assistance, most of which will start arriving within 24 to 72 hours after the storm’s initial landfall. Logistics businesses that wish to make a financial donation to ALAN instead can do so by visiting https://www.alanaid.org/donate/. “On a final note, we encourage businesses to give their employees who live on the Gulf Coast ample time to prepare or evacuate, even if it means closing down early or temporarily suspending operations,” she said. “Staying safe should always be priority number one. “We hope that these efforts and our advisories will prove to be merely precautionary and that Tropical Storm/Hurricane Francine’s effects won’t be as significant as predicted. Meanwhile, please join us in holding good thoughts for the residents of the Gulf Coast.”  

Orchestrating the Future: PepsiCo/FLNA’s Warehouse Transformation with AutoScheduler.AI’s AutoPilot

Free Online Webinar at 2:00 PM ET on Thursday, September 12, 2024 AutoScheduler.AI has announced the company is sponsoring a webinar hosted by DC Velocity magazine to discuss PepsiCo/FLNA’s (Frito Lay North America) warehouse transformation using AutoScheduler.AI’s AutoPilot. Keith Moore, CEO of AutoScheduler.AI, and Peter Hanna, a leader at PepsiCo, will share how AutoPilot is revolutionizing operations at PepsiCo/FLNA. Faced with rising demand, shrinking margins, and complex operations, PepsiCo turned to AutoScheduler.AI’s cloud-based AutoPilot platform to optimize warehouse operations and improve efficiency, including a 30% increase in product picks per hour. “PepsiCo has been focused on driving value for customers through innovative supply chain processes that improve fulfillment times, reduce operating costs, and maximize productivity,” says Keith Moore, CEO of AutoScheduler.AI. “Our AI algorithms can prioritize customer orders based on predefined rules and criteria while considering warehouse constraints, which helps to improve customer satisfaction and overall profitability.” At the free webinar on September 12, 2024, at 2:00 PM ET, attendees will: Learn how AutoPilot unifies data across systems for better visibility. Discover how advanced algorithms maximize productivity and minimize costs. See how AutoPilot provides comprehensive, real-time insights for informed decision-making. Hear about the impressive gains at PepsiCo/FLNA, including a 30% increase in picks per hour. AutoScheduler.AI AutoPilot smooths warehouse operations by orchestrating and planning all activities in real-time on top of an existing WMS. It considers space, time, labor, dock doors, and more constraints to ensure that orders are fulfilled on time and in full. Clients gain efficiencies and value in their supply chains through optimized labor, schedules, touches, and inventory. Register here

Revised employment statistics and the policy implications on plastics

Plastics logo

The Bureau of Labor Statistics (BLS) recently released the 2024 Preliminary Benchmark Revision of the Current Employment Statistics (CES), revealing that total nonfarm jobs were 818,000 fewer than previously estimated for the twelve months ending in March 2024. While CES survey employment estimates are benchmarked annually against comprehensive March employment counts, the magnitude of this downward revision has raised concerns. Upward and Downward Revisions Professional and business services employment saw the largest downward jobs revision of 358,000. Manufacturing employment was also revised down by 115,000 over the same period. Conversely, there were upward revisions: private education and health services employment increased by 87,000, and transportation and other services were revised upward by 56,400 and 21,000, respectively. While specific industries did not break down the manufacturing revisions, these revisions will eventually be reflected in the monthly industry workforce statistics. Why Is this Important to the Plastics Industry?  Employment is a key economic indicator of economic growth. The labor market continues to reflect changes in the economy’s aggregate demand and supply dynamics. Therefore, revisions to employment data are neither surprising nor trivial, as they can be valuable in assessing the business landscape. First, the manufacturing sector, a primary customer of the plastics industry, is particularly important. The lower employment rate in manufacturing suggests reduced manufacturing activity, which can have both upstream and downstream ripple effects. For plastics and rubber product manufacturing, the preliminary employment estimate for July was 724,000, nearly matching the monthly average of 725,300 in 2021. Secondly, PLASTICS releases its Annual Size and Impact Report each year, which quantifies the plastics industry across the supply chain and its contribution to the broader economy.* A decrease in manufacturing employment might be offset by increased service employment. Based on 2022 data, total jobs related to the plastics industry numbered 209,000 in manufacturing and 483,000 in services. Third, changes in government data have far-reaching policy implications. Institutions, including the Federal Reserve, have publicly acknowledged that their policy actions have been and will continue to be data-dependent, and rightfully so. Still, data quality and reliability are crucial. The U.S. policy shift to support a global goal of reducing plastic production as part of a global plastics treaty is shortsighted. The effect of such a policy on the U.S. labor market is net negative, considering the interlinkages of plastics production throughout the economy’s value chain—whether in manufacturing or services. Unfortunately, with lower employment numbers than previously estimated, policies are being deliberately considered to further reduce the ability of industries to generate employment throughout the broader economy. Based on the Economic Policy Institute’s estimates, 100 direct jobs in durable goods manufacturing create a total of 744.1 jobs, while 100 direct jobs in nondurable goods manufacturing create 514.3 jobs.* The revisions in manufacturing employment by industry are yet to be released. According to the BLS, the CES will be updated when the final benchmark revision and monthly employment estimates in January 2025 are issued. *The 2024 edition of Plastics Size and Impact Report will be release at a virtual Executive Briefing to PLASTICS members and Press on September 19, 2024, at 2:00 PM. For additional information and to register visit: https://events.plasticsindustry.org/SIZEnIMPACT24 *Bivens, J. Updated employment multipliers for the U.S. economy. Economic Policy Institute, Washington, DC. January 23, 2019. https://www.epi.org/publication/updated-employment-multipliers-for-the-u-s-economy/

August 2024 Logistics Manager’s Index Report® LMI® at 56.4

August 2024 LMI graph

Growth is INCREASING AT AN INCREASING RATE for Inventory Levels, Inventory Costs, Warehousing Capacity, Warehousing Prices, Transportation Capacity, and Transportation Utilization. Growth is INCREASING AT A DECREASING RATE for Warehousing Utilization and Transportation Prices The Logistics Manager’s Index reads in at 56.4, down slightly (-0.1) from July’s reading of 56.5. The overall index has now increased for nine consecutive months. The index has been remarkably consistent, reading in at 55.6, 55.3, 56.5, and 56.4 over the last four months (for a standard deviation of 0.5) as the logistics industry has continued its slow, steady expansion. The major move of the August report are Inventory Levels, which are up (+6.1) to 55.7, breaking the streak of contraction that we had observed over the previous three months. This suggests that after running inventories down, firms are building them back up again in anticipation of Q4. This suggests a return to traditional patterns of seasonality that we have not seen since pre-COVID. This buildup of inventories is somewhat tempered by increases in both Warehousing Capacity (+5.0) and Transportation Capacity (+5.8). While it may seem somewhat incongruous for there to be more available capacity when inventories are up, there are some reasonable explanations when we dig into the details. The expansion of Transportation Capacity could be some smaller carriers or owner-operators “getting off the sidelines”. Transportation Prices read in at 61.6. This means that prices have increased consecutively in seven of the last eight months as well as in the last four. The prices are still nowhere near the highs of 2020-2021, but it is a marked shift from the 18 consecutive months of contraction from July 2022 to December 2023. The signs of new life in the freight market, along with anticipation of the traditional jump in demand that follows the Labor Day holiday, are likely causing some of the capacity that had been sidelined over the past two years to re-enter the market, accounting for the mild increase in available capacity. Warehousing Capacity increased at least partly because Downstream Inventory Levels are still decreasing at 46.3 (although this is a notably slower rate than July’s 40.0). As a result, downstream capacity is increasing significantly faster than upstream (67.6 to 56.8). We would expect this to shift as inventories matriculate downstream to retailers. If this does not happen, it may mark a slower-than-expected peak season. That being said, Warehousing Prices are still up (+2.8) to 63.1, with more of the cost increase coming from Downstream respondents who reported a growth rate of 67.6. Researchers at Arizona State University, Colorado State University, Florida Atlantic University, Rutgers University, and the University of Nevada, Reno, and in conjunction with the Council of Supply Chain Management Professionals (CSCMP) issued this report today. Results Overview The LMI score combines eight unique components that comprise the logistics industry, including inventory levels and costs, warehousing capacity, utilization, and prices, as well as transportation capacity, utilization, and prices. The LMI is calculated using a diffusion index, in which any reading above 50.0 indicates that logistics is expanding; a reading below 50.0 indicates a shrinking logistics industry. The latest results of the LMI summarize the responses of supply chain professionals collected in August 2024. The LMI read in at 56.4 in August, nearly unchanged (-0.1) from July’s reading of 56.5. This continues the run of moderate expansion that we have observed throughout 2024. It is interesting that the rate of expansion in the overall index has plateaued between 55.0 and 56.5 throughout most of the year (with March’s 58.3 and April’s 52.9 being the only exceptions). This is a modest growth rate below the all-time average of 61.8. The overall index has been below the all-time average every month since June 2022, when it read in at 65.0. In their future predictions, respondents predict that within the year, the overall index will reach 62.4, which is consistent with their forecasts throughout the summer and will bring us back in line with that all-time average. The logistics industry is a leading indicator and barometer for economic activity. It will be interesting to continue monitoring these movements over the next year and to see whether or not we see any acceleration past the slow, steady growth that has characterized the logistics industry throughout 2024 (which, it should be pointed out, has been a relief relative to the contraction or anemic growth we saw throughout 2023). The slow, steady growth of the LMI, in many ways, mirrors the overall U.S. economy. U.S. GDP for Q2 was revised up to 3.0% growth, which is up 0.2% from the initial estimate of 2.8%. Morgan Stanley’s current estimate for Q3 growth is 2.3% (up from the previous estimate of 2.1%)[1]. The PCE price index also came in slightly lower, moving down from 2.6% to 2.5%, providing another data point for the normalization of inflation[2]. This spending comes despite revisions showing that 818,000 fewer jobs were created between April 2023 and March 2024 than were initially reported[3]. This mix of strong spending with a softening labor market significantly increases the chances that the Fed will cut interest rates by at least a quarter point at their September meeting, something that would begin the process of loosening up spending for both the Downstream and Upstream supply chain. Despite the dip in PCE, Americans increased their spending at retailers in July, with sales up 1% from June’s reading. This is the largest month-to-month increase in consumer spending since January 2023[4]. Spending was spurred by the continued cooling of prices, which rose by only 0.2% from June to July – a far cry from the 2.5% increase from the same period in 2023[5]. There is also a seasonality element; the National Retail Federation (NRF) estimates that U.S. consumers spent $38.8 billion ($875 per household) on back-to-school shopping. This is down slightly from last year’s $41.5 billion spent but still represents the second-highest back-to-school season on record[6]. Despite this, the U.S. economy continues to be tougher on lower-income individuals. This is evidenced by

Research into AI adoption finds U.S. service companies held back by lack of skills, security concerns, and legacy systems

IFS_logo_2023

However, there is optimism that Industrial AI will improve quality control and bring new sustainability gains Research from IFS, a technology provider of enterprise cloud and industrial AI software, shows despite high levels of AI optimism among service companies, hurdles still stand in the way of successful AI adoption and deployment. Limited skills & expertise (38%), ethical/safety/security concerns (36%), and a legacy-based technology landscape (36%) were identified as the top service factors slowing adoption progress. What’s more, only 58% of respondents working in the service industry felt their industry was adopting AI faster than others—the lowest score out of all industries surveyed. However, there is optimism about the benefits of AI. Cost reductions/margin gains (31%) and mitigating risk (31%) are the two areas where service companies expect AI to make large differences. Sustainability planning also correlates directly with overall AI optimism. The less wide-ranging an industry’s sustainability strategy was regarding AI, the less likely they were to be optimistic about AI in general. Interestingly, most service respondents with an AI strategy for sustainability believe it can have the biggest impact through quality control and reducing product discarded (22%), alongside regular simulation and optimization of the business targeted to meeting sustainability goals (22%). Christian Pedersen, Chief Product Officer, IFS, commented: “At the surface level, the lack of optimism across some respondents may suggest we are at the edge of a trough of disillusionment, particularly following the all-encompassing hype that AI enjoyed for much of the last 18 months. “The lofty expectations for AI bely a fundamental misunderstanding of how it is supposed to drive value. The real power lies in Industrial AI, where data flows through every part of your business, combining structured, interlinked datasets to uncover insights, optimize every process, and marry the digital with the physical world. If a business doesn’t have a strategy to reach that point, then they need a partner who can guide them on that journey,” concluded Pedersen. There are more insights and actions in the Industrial AI: the new frontier for productivity, innovation and competition Executive Report. The IFS Global AI Optimism League Table by Country Research Methodology Censuswide surveyed 1,709 C-level/President/SVP/Directors who work in Services, Manufacturing, Telecommunications, A&D, Construction & Engineering, or Energy & resources in organizations with $50m+ annual revenue (Aged 18+) across the U.S., Canada, UK, Germany, France, UAE, Norway, Japan, Australia, Sweden, Denmark and Finland.

Women In Trucking Association announces its September 2024 Member of the Month

Lehua Anderson headshot

The Women In Trucking Association (WIT) has announced Lehua Anderson as its September 2024 Member of the Month. Anderson is a professional driver for GP Transco, a trusted leader in transportation that delivers excellence and innovative solutions for the trucking and logistics industry. Originally from Moloka’i, a tiny island in Hawaii, Anderson relocated and was raised in rural Alaska, where much of the population survived on fishing, farming, and hunting. This upbringing, surrounded by a family of towering Polynesian men, showed her that challenges are meant to be conquered, regardless of gender norms. “Men don’t scare me,” says Anderson. Once Anderson’s children moved out, she and her husband decided they wanted to travel and began pursuing professional truck driving careers. Now, with a staggering 25 years of overall experience, she enjoys the freedom of driving, saying, “I don’t have to manage or supervise anyone, and I have the freedom to make my own choices about when my day is going to start and where I want to go.” For Anderson, trucking isn’t just a profession; it’s a passion forged through years of dedication and a deep-seated love for the open road. Anderson stresses the importance of researching and finding a company that prioritizes the safety of its drivers, especially as a woman in a male-dominated industry. As an example, while at her first company, she recalls a time she got stuck in a blizzard with no heat in her truck. Anderson relied on her ten years of living in Alaska to survive, showcasing her ability to navigate any roadblock with finesse and confidence. Anderson is a beacon of strength and resilience in the trucking world, where grit and determination pave the way. Her journey with GP Transco is about miles driven and overcoming obstacles with unwavering courage. As Anderson continues to drive forward with GP Transco, she embodies the perseverance that defines the Women in Trucking community. Her story inspires admiration and a profound respect for those who dare to break barriers and pave new paths in the trucking world.

Port’s small business spending surpasses $55 Million

Port’s Small Business Spending image

Effort to broaden opportunities to more firms exceeds goal by 15% A commitment by the Port of Long Beach to include more small businesses among its vendors and contractors continues to be extraordinarily successful, broadening access to port-related construction and professional services contracts. Last fiscal year, almost 42% of Port funds spent on eligible contracts through the Port’s Small Business Enterprise Program went to purchase needed services and materials from companies defined as “small business enterprises” and “very small business enterprises.” The 41.8% participation by small and very small businesses in contracting in fiscal year 2023 is the second-highest since the program was started in 2004, behind only 48.9% in 2022. The amount of applicable spending on construction projects, consulting services, event planning, and other supplies and services, rose year-over-year from $54.2 million to $55.7 million. The goal set for small business enterprise participation at the Port, which is the Harbor Department of the City of Long Beach, is 27%, higher than many peer agencies. “The SBE program provides opportunities to a wider, more diverse range of local contractors, suppliers and other businesses, which strengthens the local economy,” said Port of Long Beach CEO Mario Cordero. “As an additional benefit, we believe this practice also increases competition for tens of millions of dollars in public contracts each year, resulting in better outcomes and even more value.” “The Port of Long Beach is a job creator for our community and beyond, but we recognize it’s not enough to merely serve as an economic engine,” said Long Beach Harbor Commission President Bonnie Lowenthal. “This program was created to ensure there’s a place for smaller companies to benefit from the economic opportunities.” The thresholds of annual receipts and number of employees for classification as a small business vary widely by industry, as determined by the U.S. Small Business Administration. The very small business eligibility is equivalent to the state of California’s microbusiness designation – businesses with $5 million or less in annual gross sales, averaged over the last three fiscal years, or manufacturers with 25 or fewer employees. Aspiring contractors for the Port apply for posted contracts on the Port’s “Planet Bids” online system, where the business owners can pre-register their companies and check back for posted bids. The Port of Long Beach is a global leader in green port initiatives and top-notch customer service, moving cargo with reliability, speed and efficiency. As the premier U.S. gateway for trans-Pacific trade, the Port handles trade valued at $200 billion annually and supports 2.6 million jobs across the United States, including 575,000 in Southern California. In 2024, industry leaders named it “The Best West Coast Seaport in North America” for the sixth consecutive year. During the next 10 years, the Port is planning $2.3 billion in capital improvements aimed at enhancing capacity, competitiveness and sustainability.

Staffing index rebounds back to 90 in August

American Staffing Association Monitor Report logo image

The year-to-year gap narrows, new starts down from the previous week Staffing employment increased during the week of Aug. 12-18, with the ASA Staffing Index edging up by 0.4% to return a rounded value of 90. The index declined as usual over the July Fourth holiday and has seen a slower recovery when compared with previous years. Staffing jobs were down 11.1% compared with the same week last year, narrowing the gap by around one percentage point from the previous week. Staffing companies listed no primary factor that prevented further growth. New starts, however, saw a decrease in the 33rd week of the year, down by 7.2% from the prior week. More than three in 10 staffing companies (35%) reported gains in new assignments week-to-week—below the average of 42% per week so far this year. The ASA Staffing Index’s four-week moving average increased from the prior week to hold at a rounded value of 89, and temporary and contract staffing employment for the four weeks ending Aug. 18 was 12.2% lower than the same period in 2023. “The index has finally recovered from its seasonal, midyear dip, and has returned to a steady-state value of 90 for 2024. This year, it took seven weeks for the index to recover from the July Fourth dip, compared with just three weeks in the previous two years. Cooling labor market activity and subdued labor churn likely extended this year’s recovery time for the index, but these conditions are anomalies that will begin to ease once interest rates are lowered next month as expected,” said Noah Yosif, chief economist at ASA. This week will be used in the August monthly employment situation report scheduled to be issued by the U.S. Bureau of Labor Statistics on Sept. 6. The ASA Staffing Index is reported nine days after each workweek, making it a near real-time measure of staffing employment trends. ASA Staffing Starts are the number of temporary and contract employees placed in new assignments during the reporting week. ASA research shows that staffing employment has historically been a coincident economic indicator.

Safety 2024 attendance in Denver soars above previous record

The American Society of Safety Professionals logo

The signature event of the American Society of Safety Professionals (ASSP) attracted 6,758 workplace safety and health professionals this month to set a new attendance record for the global event. An additional 217 people joined a livestream session while 4,360 exhibitor representatives populated the expo hall, ultimately involving more than 11,000 people at the sold-out Safety 2024 Professional Development Conference and Exposition in Denver. “We saw an overwhelming desire from safety professionals to network with colleagues and stay current on best practices, industry trends and the latest product innovations,” said ASSP President Pam Walaski, CSP, FASSP. “The turnout was beyond our wildest dreams. Safety 2024 was an incredible success.” The registered attendance at the Colorado Convention Center from Aug. 7-9 far surpassed ASSP’s previous record of 5,937 attendees from Safety 2023 in San Antonio. It is one of America’s largest annual conferences for the advancement of workplace safety and health that began in Chicago in 1962. Boosting Safety 2024’s popularity was a dynamic expo with more than 650 vendor booths that covered nearly 120,000 square feet. The extensive product showcase was a key element of the overall experience, incorporating new and expanded elements such as tech talks, flash sessions and a career advancement center. “Our expo is so engaging that we get some safety and health professionals coming only for that,” Walaski said. Safety 2024 welcomed more than 3,500 first-time attendees, making up more than half of the total attendance. About one-third of the record crowd was non-members. Those who had never been an ASSP member received a free year of membership. The extraordinary results signal future growth for ASSP and the occupational safety and health profession. “We’re proud to be a global leader in providing professional development for the workplace safety and health community,” Walaski said. “Our event shares case studies and new safety approaches along with vast networking opportunities that help practitioners solve safety challenges and advance their careers.” The conference surpassed its $25,000 fundraising goal as participants donated nearly $27,000 to the ASSP Foundation, including a $10,000 match from Liberty Mutual. The ASSP Foundation promotes occupational safety and health as a career choice and works to build a sustainable talent pipeline in the profession that will help make all industries safer worldwide. Looking ahead to next year, ASSP’s Safety 2025 will take place July 22-24 in Orlando at the Orange County Convention Center, the second-largest convention facility in the nation. Orlando is known for its sunny weather and world-famous theme parks. The city is also home to The Orlando Eye, a stunning 400-foot Ferris wheel at Icon Park that ranks among the 10 largest in the world. The attraction is only 1 mile from the convention center.

What Fed Chair Powell’s address means for manufacturing

Today, Federal Reserve Chair Jerome Powell gave the most concrete signal yet that interest rate cuts are on the horizon at his Jackson Hole press conference. The outlook is promising for manufacturers and those in the industry closely watching the developments and anticipating IMTS 2024 – The International Manufacturing Technology Show. “The increased likelihood of a September rate cut after Fed Chair Jerome Powell’s Jackson Hole address will likely boost manufacturing technology orders through the remainder of 2024, further amplifying the residual effects of an IMTS show year,” says Christopher Chidzik, principal economist at AMT – The Association For Manufacturing Technology. “With capacity utilization rates remaining at historically elevated levels in industrial sectors, additional investment in capital equipment will be necessary for manufacturers to address any sudden spikes in demand without a return of supply-side inflationary pressures.”

Automated Micro-Fulfillment Centers (MFCs) market needs to overcome challenges to reach forecast $3.5bn by 2030

MFCs graph

Market challenges post-Covid – including rising living costs, project delays and bottlenecks – will need to be overcome in order for the sector to flourish. Opportunities for the automated Micro-Fulfillment Center (MFC) market are growing substantially over time due to the rising demand for shorter delivery times. Providing vendors address the barriers to adoption, the MFC market is projected to grow at a CAGR of 65% from 2023 to 2030, reaching over $3.5 billion annually by 2030. According to the latest report from Interact Analysis, the market for automated micro-fulfillment centers (MFCs) has witnessed a series of challenges to adoption. However, the market opportunity remains high. To reach widespread adoption, several barriers need to be overcome. Assuming these barriers are overcome, Interact Analysis expects the market could grow to an annual revenue of $3.5 billion by 2030. Nascent stages of growth Despite initially high expectations, deploying automated MFCs has faced several challenges that fit into two categories: productivity inhibitors and hidden costs. Productivity inhibitors include integrating manually picked items, with those selected by automation proving inefficient, reducing overall system throughput. Advancements in manual in-store fulfillment software have also narrowed the ROI gap, diminishing the appeal of automated solutions. Additionally, macroeconomic factors, such as rising living costs, have also encouraged consumers to favor in-store shopping over delivery services, further dampening demand. Furthermore, hidden costs like construction delays and process refinements – along with productivity inhibitors like bottlenecks in the consolidation of manually picked items and MFC replenishment – have also negatively impacted ROI, making the adoption of automated MFCs less attractive. These barriers to adoption must first be addressed. If they aren’t, the number of MFC deployments will be lower than expected. Addressing the barriers to adoption As part of the research process, Interact Analysis identified several key strategies MFC vendors should adopt to address the previously mentioned barriers to adoption. These include sophisticated fulfillment software, flexible and scalable automation solutions, effective pricing models, and many others. To address the barriers to adoption discussed above, vendors must be able to provide expansive fulfillment software. Online grocery fulfillment is complex and involves the processing of orders, quickly. Automated MFC’s offer the capability to integrate hardware, software, and human labor to solve these logistical challenges efficiently. Flexibility and scalability are also key. Automation solution providers must be able to provide solutions that cater to different facility sizes while ensuring that they enhance the ROI for retailers. The level of complexity of the solutions must also be considered. Retailers want to be able to install the solution without the need to spend time and money training workers. Many automation providers have successfully done this by having user-friendly interfaces installed on the technology. What does the future hold for MFCs? Overall, the market for Automated Micro-Fulfillment Centers (MFCs) is projected to experience significant growth, with a forecast compound annual growth rate (CAGR) of 65% from 2023 to 2030, reaching a market size exceeding $3.5 billion annually by 2030. In 2024 alone, Interact Analysis predicts that grocers will spend $18.5 billion on store labor for online order picking. By comparison, the total warehousing sector will spend ~$180 billion on labor, meaning that grocery in-store fulfillment labor cost equates to 10% of the total warehouse labor costs. The market is witnessing a bifurcation, with smaller sites for convenience orders and larger sites for weekly shop orders. As a result, technologies such as mobile AS/RS, shuttle AS/RS, and ultra-high-density storage systems are expected to play a significant role in fulfilling weekly shop orders, while nanofulfillment solutions are primarily going to be used in the fulfillment of convenience orders. Labor is generally still being used for manual in-store picking but the total addressable market for MFCs through localized fulfillment is increasing. Overall, the e-commerce market value for localized fulfillment is expected to increase from $1.9bn in 2023 to $4.4bn in 2030. This is mainly driven by the grocery segment but also other verticals such as healthcare and general merchandise due to the demand for shorter delivery times. Rowan Stott, Research Analyst at Interact Analysis, comments: “The market is in its early stages of growth, with several barriers to adoption in the MFC industry that haven’t been addressed yet by vendors. We believe that addressing these will be the most important factor in determining future growth. “Overall, the automated MFC market is poised for substantial growth, driven by the increasing demand for localized fulfillment and advancements in automation technologies. As major retailers continue to invest in these solutions, the market is set to rapidly expand, offering significant opportunities for vendors and stakeholders in the industry.” About the report Over the years, we’ve developed and refined our view of what micro-fulfillment is and how to define it. We’ve come to the conclusion that micro-fulfillment is less about the size of the facility, but rather more about the radius of delivery. As such, the scope of this report is constrained by delivery radius, rather than facility size. In addition to providing a wealth of granular market data, this report will also explore what the biggest barriers limiting the uptake of micro-fulfillment centers, along with the key attributes that retailers are looking for when selecting an automation partner.

ASSP recruiting presenters for Safety 2025 in Orlando

The American Society of Safety Professionals logo

The American Society of Safety Professionals (ASSP) is seeking a diverse group of occupational safety and health professionals to present at the Safety 2025 Professional Development Conference and Exposition in Orlando. The submission deadline is Sept. 11. Safety 2025 – scheduled for July 22-24 at the Orange County Convention Center – will be attended by more than 6,000 occupational safety and health professionals looking for solutions to today’s workplace safety challenges. Industry experts share best practices that can help protect workers and enhance business operations in every industry worldwide. ASSP’s call for presenters involves one-hour concurrent sessions that focus on business and leadership skills, fall protection, risk assessment and management, prevention through design, standards, emergency action plans and many other topics. Prospective speakers must identify emerging issues, develop strategies for overcoming safety challenges and aim to expand attendee knowledge and professional skills. “It’s a terrific opportunity for safety and health experts to contribute to the development of their colleagues while advancing our industry,” said ASSP President Pam Walaski, CSP, FASSP, who has been a conference speaker every year since 2005. “Being a safety presenter is truly a rewarding experience.” ASSP members serving on the Society’s Conference Planning Committee will evaluate all speaker proposals against the following criteria: Degree to which the session meets ASSP’s education objectives. Interest and need for the topic within the occupational safety and health profession. Speaker’s presentation skills and experience. Interested presenters must submit a separate application for each session, with a maximum of two proposals. Please direct questions to ASSP’s professional development team at PDCspeaker@assp.org. Session proposals for Safety 2025 must be submitted online by Sept. 11. ASSP will notify successful applicants through email by the end of February.

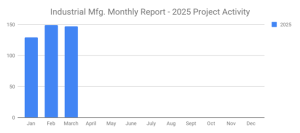
Summer slowdown hits in July 2024 with 138 new Industrial Manufacturing Planned Industrial Projects

SalesLeads July 2024 image

SalesLeads has released the July 2024 results for the new planned capital project spending report for the Industrial Manufacturing industry. The Firm tracks North American planned industrial capital project activity, including facility expansions, new plant construction, and significant equipment modernization projects. Research confirms 138 new projects, compared to 164 in June. The following are selected highlights of the new Industrial Manufacturing industry construction news. Industrial Manufacturing – By Project Type             Manufacturing/Production Facilities – 121 New Projects             Distribution and Industrial Warehouse – 73 New Projects Industrial Manufacturing – By Project Scope/Activity             New Construction – 54 New Projects             Expansion – 36 New Projects             Renovations/Equipment Upgrades – 54 New Projects             Plant Closings – 12 New Projects Industrial Manufacturing – By Project Location (Top 10 States) Texas – 11  Ohio – 9 Indiana – 8 Illinois  – 7 Michigan – 7 Pennsylvania – 7 California – 6 Georgia – 6 Massachusetts – 6 Ontario – 6 Largest Planned Project During the month of July, our research team identified 27 new Industrial Manufacturing facility construction projects with an estimated value of $100 million or more. The largest project is owned by Substrate, Inc., which plans to invest $108 billion in constructing a three million-square-foot manufacturing complex in BRYAN, TX. Substrate is currently seeking approval for the project. Top 10 Tracked Industrial Manufacturing Projects MISSOURI: A federal agency plans to invest $3 billion to expand its nuclear weapon component manufacturing complex in KANSAS CITY, MO, by 2.5 million SF. Construction will occur in multiple phases, with the completion of the 1st phase slated for Summer 2026.  TEXAS: A federal agency plans to invest $1.4 billion in constructing a semiconductor manufacturing and office campus at the University of Texas in AUSTIN, TX. They are currently seeking approval for the project, which will occur in two phases. VIRGINIA: Industrial wire and cable MFR. plans to invest $681 million in constructing a 750,000 SF manufacturing and warehouse facility at 1213 Victory Blvd. in CHESAPEAKE, VA. Construction is expected to start in early 2025 and complete in early 2028. OKLAHOMA: Solar panel component MFR. plans to invest $620 million in constructing a manufacturing facility at Tulsa International Airport in TULSA, OK. They are currently seeking approval for the project. Construction is expected to start in late 2024, with completion slated for 2026. CALIFORNIA: A steel fabrication company plans to invest $540 million to construct a 551,000-square-foot manufacturing and warehouse complex on Sopp Rd. in MOJAVE, CA. They are currently seeking approval for the project. GEORGIA: Tire Manufacturing Company is considering investing $500 million to construct a manufacturing facility and is seeking a site in Georgia. Watch SalesLeads for updates. MICHIGAN: Automotive MFR. plans to invest $500 million for the renovation and equipment upgrades on their manufacturing facility at 920 Townsend St. in LANSING, MI. They are currently seeking approval for the project. KENTUCKY: Automotive MFR. is planning to invest $400 million in constructing a manufacturing facility in SHELBYVILLE, KY, and is seeking approval for the project.  NORTH CAROLINA: Medical device MFR. plans to invest $400 million in constructing a 550,000 SF manufacturing, warehouse, office, and training campus at 1911 Old Creek Road in GREENVILLE, NC. Construction is expected to start in Fall 2024 and be completed in late 2026. ILLINOIS: Automotive mfr. plans to invest $334 million in renovation and equipment upgrades at its manufacturing facility in BELVIDERE, IL. It is currently seeking approval for the project. About Industrial SalesLeads, Inc. Since 1959, Industrial SalesLeads, based in Jacksonville, FL, is a leader in delivering industrial capital project intelligence and prospecting services for sales and marketing teams to ensure a predictable and scalable pipeline. Our Industrial Market Intelligence, IMI, identifies timely insights on companies planning significant capital investments such as new construction, expansion, relocation, equipment modernization, and plant closings in industrial facilities. The Outsourced Prospecting Services, an extension to your sales team, is designed to drive growth with qualified meetings and appointments for your internal sales team. Visit us at salesleadsinc.com.

As the rental, financial and technology markets change, is your dealership?

Garry Bartecki headshot

Much is going on that impacts OEMs, Equipment Dealers, Financing Sources, and Customers. Inflation, supply chain disruptions, and geopolitical tension lead to cautious customer behavior, thus creating new levels of management manipulation to keep the ships upright. In addition to these significant disruptive sources, you add the risk associated with technology decisions, not only for your company but also for a high percentage of your customer base familiar with emerging technologies. Here are just a few concerns dealers have on their minds: Revenue per employee Tariffs Tax opportunities Overtime Regs On-shoring Near-shoring AI and IT for manufacturers AI and IT for warehouse and distribution centers Having products and services to fit the needs of manufacturers and distributors Finding other programs and methods to increase sales. Providing consulting services to customers. Emerging Technology Electrification Hydrogen cells Inventory changes and management. Supply chain disruption Collateral value of equipment Planning for rental income to represent a higher % of sales. Resale value uncertainty Bank and Financial source education Programs to find and keep personnel Cybersecurity threats Supply chain management Need for more dealer consolidation Quarterly cash flow requirements Cap-X for AI, IT, and customer consulting And I am sure you are also trying to hire to fill talent needs throughout your organization. And how about those equipment prices? Used values are falling, leaving you with the problem of having high-priced pandemic units now dropping in price and a collateral problem with the banks. And let us not forget the new elephant in the room….AI. Making an AI decision can be high risk if you do not know what you are doing, so MHW is premiering a new column next month to help with the process. And as far as your sales silo is concerned, you will be adding new accounts to track new types of equipment, including automated guided vehicles, and different types of fuel sources being offered, such as electric trucks using lithium-ion batteries as well as hydrogen fuel cells. We can all agree that customers will look to YOU to provide insight into what type of unit best fits their needs. I have heard hydrogen is growing its market share because it is cheaper and avoids the “green costs” associated with mining and disposing of lithium. All these issues have produced some interesting discussions with bankers. CEO and shareholder anxiety must be the name of the game regarding the balance of 2024. As I have said in the past, if you are not ready or able to roll with the punches and make the investments necessary to stay in the game, it may be time to investigate transitioning out of the industry. Consolidation is taking place in all types of markets, with equipment dealers and rental companies appearing in every business publication I read. One final option before pulling the plug is to find and hire a manager prepared to deal with the issues at hand. On the FINANCING side of the business, banks and finance companies are having their own problems because many customers are experiencing cash flow challenges, resulting in payment delays to either the bank or dealer. Credit risks are also increasing because of economic uncertainty affecting dealers and customers. Having numerous financing sources available is a must for today’s markets. Financing sources are asked to finance unfamiliar new types of equipment for both the dealer and customers. Lenders must contend with the value of what is currently on their balance sheet instead of financing new equipment types with which they have zero history of working. Consequently, dealers should prepare examples of the expected values of the equipment over at least a five-year period. Dealers should prepare an annual equipment appraisal covering used equipment inventory and rental units. I also suggest you track the sales of your used equipment and compare the sales price to what appears in the valuation report. If you can show the bank that you are selling used equipment for more than what appears in the valuation report, the bank will rely more on the report when considering your credit requests. Remember that many buyers are waiting for interest rates to be reduced before purchasing new or used equipment. If so, sales will be deferred, reducing the cash flow to finance the business. I see that rental activity is increasing rather than purchasing units, eventually impacting dealer cash flow and borrowing capacity. Dealers will have little say in how all this works out. Changes in emerging technology and advancements in warehouse automation and shop floors will dictate what lift truck dealers must provide. The trick will be eliminating the old, bringing in the new, and becoming more efficient using the latest technology and AI (if it works for you). Cash flow schedules incorporating these changes should be adjusted and updated quarterly to stay ahead of the game—notice I said cash flow schedules, not budgeting worksheets. In the end, the revenue silos will produce less profits and cash flow, and dealers need to be prepared to deal with this situation. On the other hand, you may be selling more technical equipment and systems that make up for reductions in other sale categories. Change is coming faster than you think. Be prepared to produce a company ready to provide products and services and consulting to the ever-changing manufacturing and distribution world you will be living in. About the Columnist: Garry Bartecki is a CPA MBA with GB Financial Services LLC and a Wholesaler columnist since August 1993.  E-mail editorial@mhwmag.com to contact Garry.

Bringing dead customers back to life

Jeffrey Gitomer image

You lost a customer. You’ve probably lost lots of customers. You don’t want to think about them. It’s painful. In fact, you’re reading this and have already had a few instant thoughts about this one or that one. Makes you mad, doesn’t it? They’re dead and buried in that great customer graveyard in the sky. A graveyard full of unfulfilled promises, screwed up deliveries, missed deadlines, wrong billing, crappy service… want me to keep going? Two more thoughts: lost revenues and lost profits. More? One more thought: lost commissions. That one hurts. Especially the ones “you were counting on.” The ones you “already spent.” It makes you madder, doesn’t it? Well, I have great news. Keep thinking about them. They’re gone but not forgotten. Dead, but not buried. I challenge you to reconnect with them as soon as possible. They have money waiting for you. TRUE STORY: A newly hired sales regional manager for a Fortune 100 company noticed two file drawers marked Code 99. When she inquired about the meaning, a rep told her, “Those are the customers who hate our guts. They have sued us, left our machines on the curb, bad-mouthed us, and said they never wanted to see us again.” She emptied the drawers and divided the files among the sales team with the directive to visit each customer, meet with the decision-maker, and find out what happened. That’s all—no sales pitch. RESULT: The results were staggering. More sales per lead than any program they had run in the past five years. Many of the old (angry) people were not there anymore, making the initial conversation much less painful and the bad memories dim or lost. From there, they discovered that there were opportunities. Sales opportunities. And the customers appreciated the straightforward courage. NOTE WELL: All customers are not lost from screwups. Often, someone came in and stole them either by lower price, or just by a better salesperson. NOTE REAL WELL: I am NOT recommending you go in with price concessions. Bad precedent for a new beginning. Bring something to the table beside “low price,” and you’ll walk away with a profit. There’s a thought. Want a customer zombie approach process that will wake up the dead? Here’s the plan: Start now. It takes courage, it takes planning, it’s a grim dose of reality, but let me assure you, it works. Get out the files and make a list of EVERY ONE OF THEM. Adopt a fun approach: Have a lost and found (customer) day. Have a lost and still fond of (customer) day. Have a lost customer appreciation day. Have a we screwed up day. IDEA: Send a dart board with your company logo in the center and a few darts and ask them to “get it out of their system” and to please let you back in their office on the condition that they keep the darts in the drawer while you’re there. Fun. Uncomfortable with fun? OK, OK… Adopt a professional approach: Send a letter with a peace offering. Send a card. Whether you use a fun or professional approach, you must also do the following: The game plan: Arrange a meeting to find out why. Find out what happened as a result of your screw-up, lack of attention, or lost order. Ask for another chance with conditions that you both set and agree to (sometimes in writing). Golden Lessons: Document the “whys” and you will be amazed to find that every reason is fixable. In fact, some have already been fixed. If corrected properly, these are the most valuable resources you have for making your business better. Pay for victories:Offer ultra rewards to salespeople, ransoms and bounties. Pay double commission or some kind of bonus for a resurrected customer. The Goal: You will win sales, profits, and a new understanding of how to improve your business from a customer’s perspective the only one that matters. The Bonus: Good will lost, and recovered. If you win the customer back, you will have re-created a story, eliminated the bad one, and replaced it with new-found testimony. Huge value. You know the old saying, “Every obstacle presents an opportunity.” Some salespeople may see this idea as “uncomfortable” or too much of an obstacle. But I promise if you can get beyond the reluctance or skepticism, you will win. You get to steal back the business and learn the “why you lost them” lessons. You get answers and sales. You get a win, while the competition gets a loss. You regain lost pride while they get a shot in the wallet. You get a commission while they get jack squat. What could be better? About the Author: Jeffrey Gitomer is the author of twelve best-selling books, including The Sales Bible, The Little Red Book of Selling, and The Little Gold Book of Yes! Attitude. His real-world ideas and content are also available as online courses at www.GitomerLearningAcademy.com. For information about training and seminars, visit www.Gitomer.com, email Jeffrey at salesman@gitomer.com, or call him at 704 333-1112.

Port of Long Beach sees busiest July on record

Cargo surge driven by back-to-school, potential tariff increases Surging cargo volumes lifted the Port of Long Beach to its most active July on record – and the third-busiest month in its 113-year history – as retailers stocked up on goods headed into the peak shipping season. Dockworkers and terminal operators moved 882,376 twenty-foot equivalent units in July, up 52.6% from the same month last year and surpassing the previous record set in July 2022 by 12.4%. Imports soared 60.5% to 435,081 TEUs, exports grew 16.3% to 104,834 TEUs, and empty containers moved through the Port jumped 57.8% to 342,462 TEUs. “We’re in a strong position heading into the peak shipping season as consumers purchase back-to-school supplies and shippers move goods ahead of potential tariff increases,” said Port of Long Beach CEO Mario Cordero. “We have plenty of capacity across our terminals and cargo continues to move efficiently and sustainably at this premier gateway for trans-Pacific trade.” “Our waterfront workforce continues to move trade through the Port at a record-setting pace,” said Long Beach Harbor Commission President Bonnie Lowenthal. “Our strong partnerships with labor and industry continue to help us meet the evolving needs of our customers.” The Port has moved 5,174,002 TEUs during the first seven months of 2024, up 20% from the same period last year.